
1 INTRODUCTION
A 120 MW Kaplan unit failed in December 2015. The reason for the failure was the detachement of the tangential keys from the rotor causing damage to the stator core (Fig. 1). To find the root cause a detailed analysis of the data from the database of the installed monitoring system was performed.
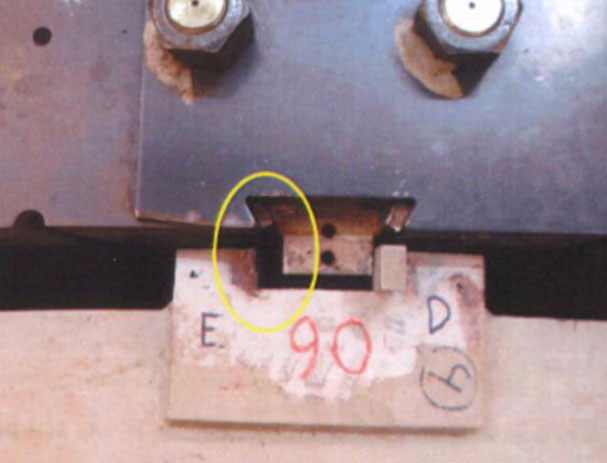
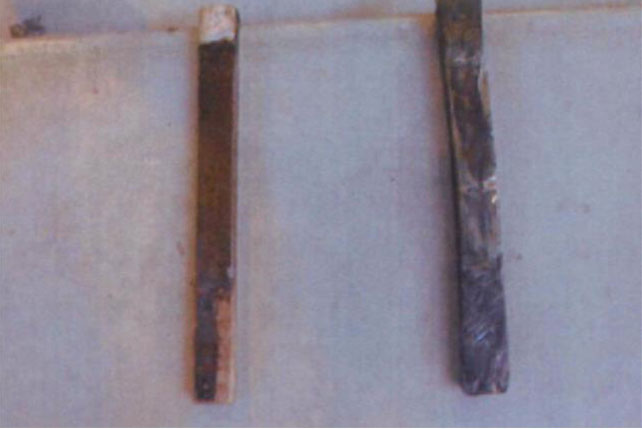 Fig. 1 TOP: Key that became loose in operation. BOTTOM: Left key is the one found in the rotor hub, right key is the one that hit the stator core.
Additionally, after the unit was repaired, vibration and air gap measurements were performed during the commissioning to provide information regarding it’s stability of operation. For this purpose, the portable measurement system CoDiS-PDS1 (Computerized Diagnostic System – Portable Data System) was used. The system enables simultaneous analysis of the vibration and air gap data.
Prior to the overhaul – it was established that 16 of the 18 guide keys (upper side of the rotor) had clearance to move and 6 of 18 torque keys (lower side of the rotor).
During the overhaul – the unit’s eccentricity was corrected, also verticality and rim interference to spider (the rim is of a shrink fit type) of 2.1 mm. Keying procedure for guide keys was improved to provide better contact between the rim and the spider and transfer the torque adequately.
2 DATA ANALYSIS
Vibration and air gap data was analyzed from the database of the installed Machine Condition Monitoring (MCM) system as a first step in the root cause analysis. As a second step, after the overhaul, analog signals from the MCM system were taken and analyzed in different operating regimes including: overspeed, mechanical rotation, rotation with excitation and load rejection from various loads.
2.1 MACHINE DESIGN AND SENSOR LAYOUT
The machine is a semi-umbrella type with the thrust bracket below the generator and two guide bearings – one above the generator and the other at the turbine level. The unit’s cross section with measurement planes and measurement directions is shown on Fig. 2.
![]()
Fig. 2 LEFT: Unit cross section with measurement planes indicated and noted. RIGHT: Sensor positions layout. Top view. Arrow indicates rotation direction (CW – clock-wise).
Three measurement planes used for relative shaft displacement (vibrations) in the radial direction were:
- Upper Guide Bearing plane – UGB
- Thrust Bearing plane – ThrB (there is no radial bearing in this plane, only axial)
- Turbine Guide Bearing plane – TGB
The planes and directions of measurement are indicated on Fig. 2. For relative vibrations – directions 0° and 90° were used.
Beside relative vibrations, useful informations were obtained using the air gap sensors installed in two planes – at the top and bottom of the stator core (AG – UP and AG – DOWN – as shown on Fig. 2). In total – there were 16 air gap sensors installed, 8 in the upper plane of the stator core and 8 in the lower plane of the stator core. The sensors in both planes were distributed at equal angles (0°, 45°, 90°, 135°, 180°, 225°, 270° and 315°) according to Fig. 2 (RIGHT).
All signals included in the measurement and analysis are shown in the following table (Table 1).
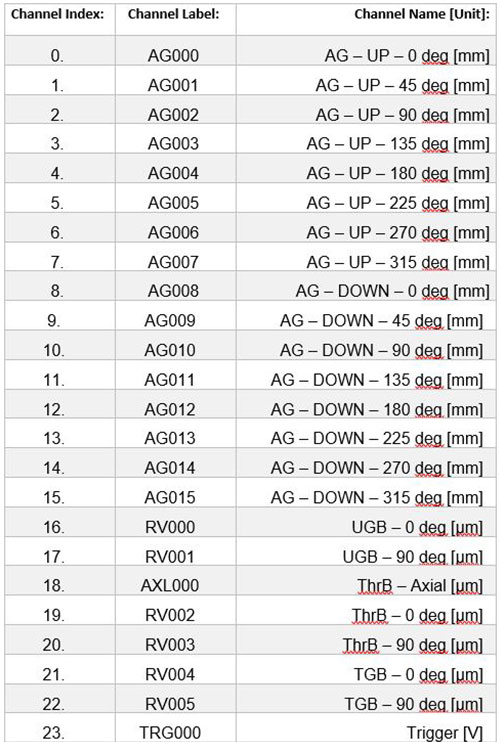
Table 1 Signal list with signal labels and names.
2.2 COMPARISON OF DATA BEFORE UNIT 2 FAILURE (JULY 2015.) AND AFTER THE OVERHAUL (AUGUST 2016.)
For comparison reasons it is interesting to compare vibration and air gap data before its failure and after the overhaul was done.
Orbits (section 2.2.1) give valuable insight into the unit’s dynamical behaviour and this data is further complemented with the air gap data (section 2.2.2) to obtain a more detailed picture of the unit’s vibrodynamical behaviour.
2.2.1 ORBITS
2.2.1.1 WITHOUT EXCITATION
Orbit diagrams for mechanical rotation (without excitation) are given before and after the overhaul for comparison.
Orbit graphs are shown as synthesized from the first three harmonics of rotational speed (left diagram), 1st harmonic only (middle diagram) and from the 2nd harmonic only (right diagram). The reason is to show how much each harmonic contributes to the overall orbit and for easier diagnostics of the potential problem.
Fig. 3 shows the data before and Fig. 4 after the overhaul. Data is shown for the UGB, ThrB and TGB planes.
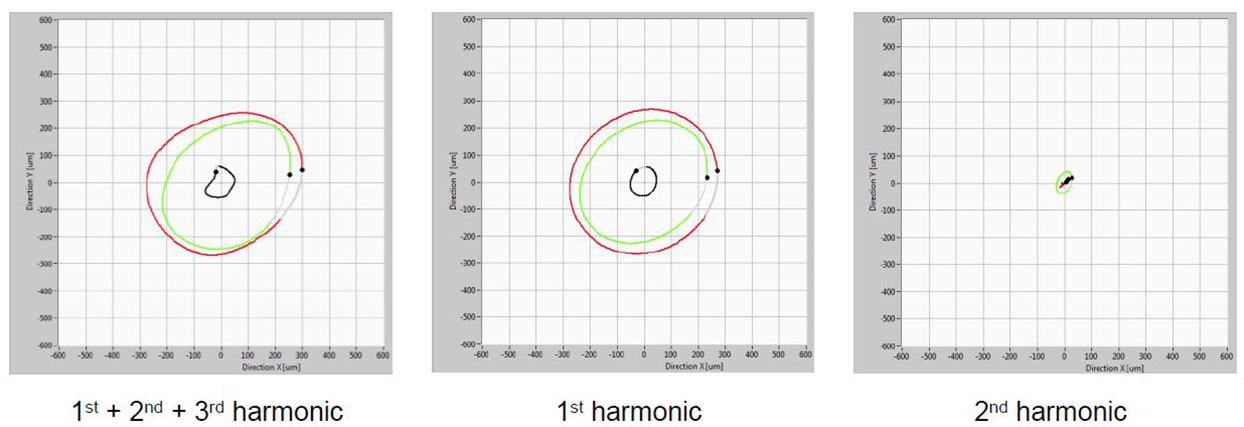
Fig. 3 Before the overhaul (July 2015): Orbit diagrams of relative vibrations in the UGB (black), ThrB (red) and TGB (green) planes in mechanical rotation (without excitation). At ~nominal rotational speed ~86.6 rpm. LEFT: synthesized from 1st + 2nd + 3rd harmonics; MIDDLE: synthesized from 1st harmonic; RIGHT: synthesized from 2nd harmonic of rotational speed.
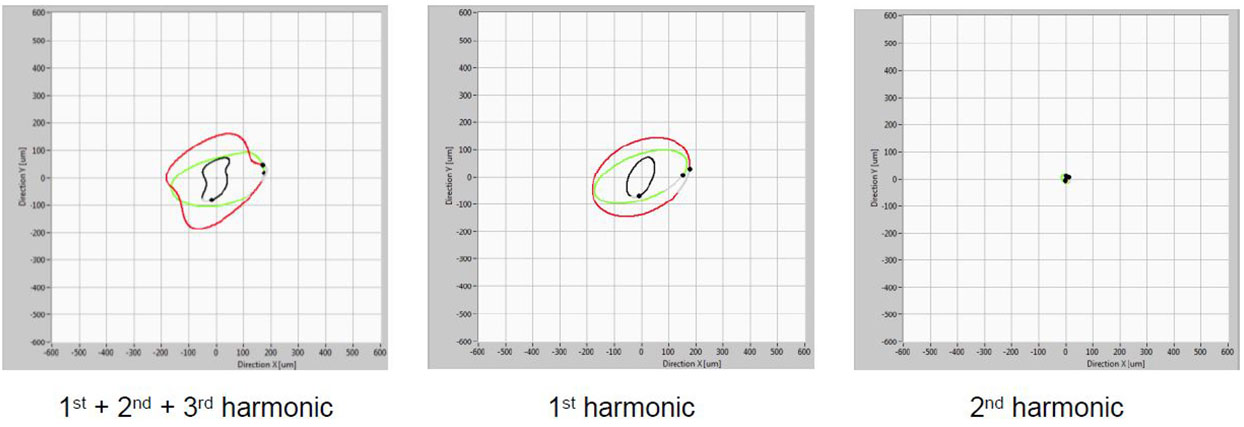
Fig. 4 After the overhaul (August 2016): Orbit diagrams of relative vibrations in the UGB (black), ThrB (red) and TGB (green) planes in mechanical rotation (without excitation). At ~85.7 rpm. LEFT: synthesized from 1st + 2nd + 3rd harmonics; MIDDLE: synthesized from 1st harmonic; RIGHT: synthesized from 2nd harmonic of rotational speed.
In general, there was a significant improvement in vibrational response in mechanical rotation after the overhaul. Vibrations were reduced as can be seen by the size of the orbit. By dynamical two-plane balancing of the generator rotor – vibrational response could be reduced further. The first balancing plane for dynamical balancing should be UGB plane and the second one should be the ThrB plane. If vibrations on ThrB will be reduced – they will automatically be reduced on TGB.
2.2.1.2 WITH EXCITATION
The data in this section is obtained when the machine is excited. One of the important indicators of the rotor/stator eccentricity is the statical shaft position change with excitation (and load increase). Comparison is made between the state before and after the overhaul.
Orbit diagrams for rotation on nominal rotational speed with excitation are shown on Fig. 5 and Fig. 6. Coordinate system’s zero position is taken when the unit was in mechanical rotation at nominal rotational speed.
To check on the influence of the excitation on the shaft center position (DC) and vibrations (AC) around this new point – statical shaft position (DC) is included in the orbit diagrams. This is shown on Fig. 5 (before the overhaul) and Fig. 6 (after the overhaul).
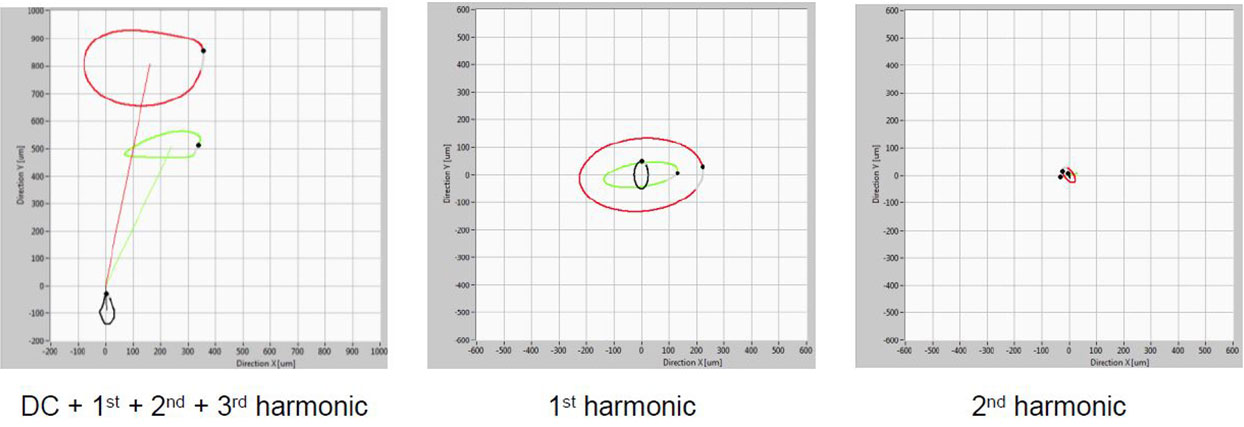
Fig. 5 Before the overhaul (July 2015): Orbit diagrams of relative vibrations in the UGB (black), ThrB (red) and TGB (green) planes in mechanical rotation (with excitation). The statical (DC) component is included in the signal. LEFT: synthesized from 1st + 2nd + 3rd harmonics; MIDDLE: synthesized from 1st harmonic (without DC); RIGHT: synthesized from 2nd harmonic of rotational speed (without DC).

Fig. 6 After the overhaul (August 2016): Orbit diagrams of relative vibrations in the UGB (black), ThrB (red) and TGB (green) planes in mechanical rotation (with excitation). The statical (DC) component is included in the signal. LEFT: synthesized from 1st + 2nd + 3rd harmonics (with DC); MIDDLE: synthesized from 1st harmonic (without DC); RIGHT: synthesized from 2nd harmonic of rotational speed (without DC).
It should be noted that the full scale ranges are the same on both figures (1200 μm) for an easier comparison between the size/ shape/ offset of the orbits.
When the changes in the orbit center exist – that means eccentricity between the rotor and stator exists and that Unbalanced Magnetic Pull (UMP) is generated. This is due to the fact that there exists radially spaced electromagnetic forces between the rotor and stator and they do not all add up to zero. So there is a force vector pointing in the eccentricity direction and it is in this direction that the rotor moves to. This movement is, eventually, counteracted with the forces originating within the bearing. A certain amount of UMP is allowed but should be under control (comparison to the bearing clearance should always be made).
If there are changes in the size and/or shape of the orbit when comparing unexcited to orbits obtained under excitation – that means there exists magnetic unbalance and/or other effects. Magnetic unbalance can cause changes in vibration phases too.
The statical (DC) shaft movement was much smaller after the overhaul meaning that the eccentricity was significantly reduced. By how much – can be seen from the air gap analyses (next section).
As for vibrational (AC) part, for data after the overhaul – it can be seen (from orbit diagrams) that the vibrations on ThrB have increased with excitation – both on 1st and 2nd harmonic of rotational speed. The change on the 1st harmonic indicates the presence of the magnetic unbalance and the change on the 2nd harmonic is, probably, caused by coupling.
Two-plane dynamical balancing, as described, with regards to comparison between mechanical rotation and rotation under excitation would reduce the vibration levels on the UGB and the TGB into zone B according to ISO 7919-5:2005 [3] be and considered acceptable for unrestricted long term operation.
2.2.2 AIR GAP DATA
Results from the air gap measurements including rotor and stator polar view are shown on Fig. 7 (from the upper measurement plane). Data before and the overhaul are compared on the figure.
Both figures are obtained in such a way that the reference data (which defines the origin of the coordinate system) is obtained in mechanical rotation (for a cold unit at nominal speed). This means that at that point in time the rotor is rotating (and possibly also orbiting) around the origin of the coordinate system. Then, data is taken for some different regime. Here, it’s taken for an excited unit since then, if eccentricity exists between the rotor and stator axes, the rotor will have a tendency to move in the direction of this eccentricity (towards the closest point to the stator to which it is pulled to).
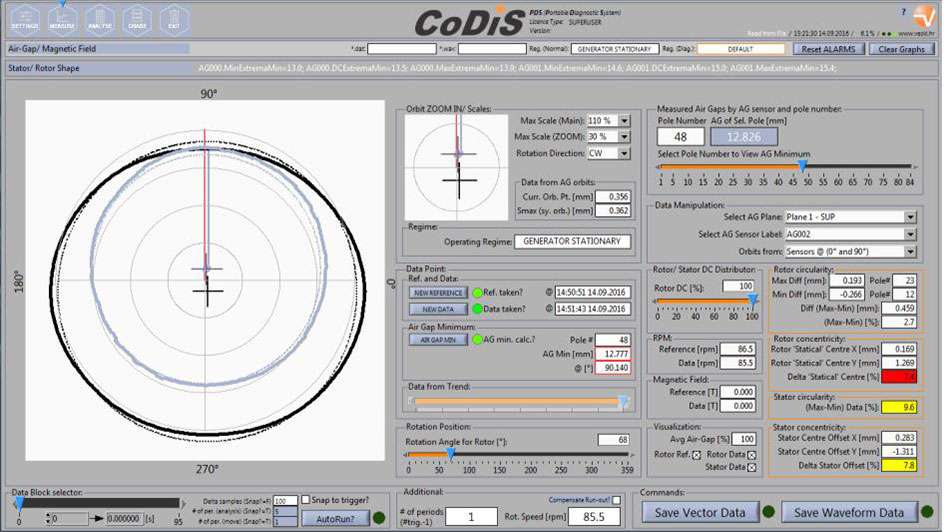
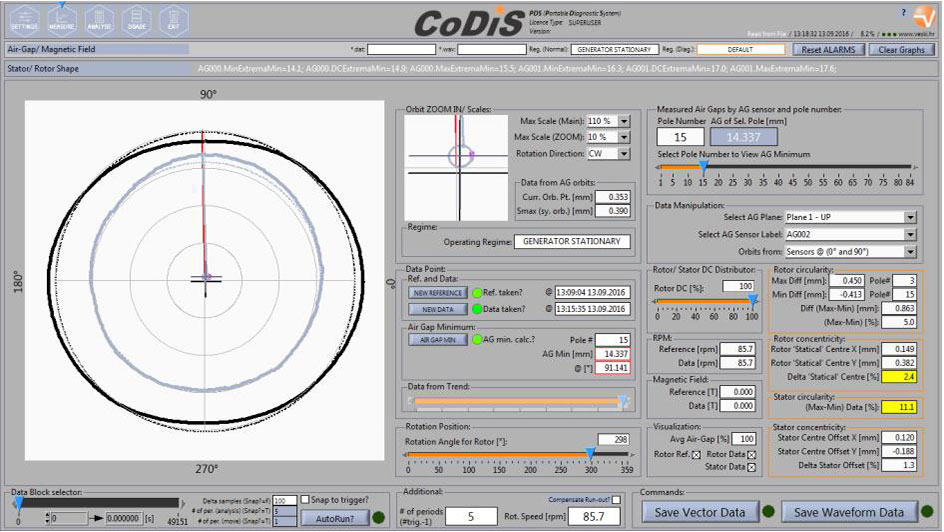
Fig. 7 Polar overview of the rotor and stator geometry in mechanical rotation and after excitation is turned on, compared to the unit’s ideal axis (center of the graph). MCM system angles are denoted differently which is indicated in this figure (0° from the analysis corresponds to MCM 90° and 90° from the analysis corresponds to MCM 0°). UPPER DIAGRAM: Before the overhaul. LOWER DIAGRAM: After the overhaul.
This behaviour is exactly what is seen from the Fig. 7. There exists a certain amount of eccentricity, which is much larger before the overhaul.
The comparison between the two states in the upper air gap measurement plane (near the top of the stator core) is given in the following table (Table 2) and can also be seen from the Fig. 7. Note that the rotor and stator concentricies are referenced to the rotor position (reference).
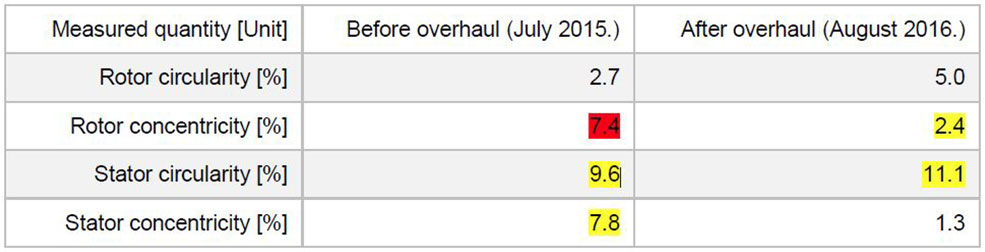
Table 2 Rotor and stator circularities and concentricities. Note that both rotor and stator concentricities are referenced to the rotor position (reference) which was taken as mechanical rotation on nominal speed.
During the overhaul – the rotor circularity (shape) was changed for ~2.3 % (from ~2.7 % to ~5 %) after the rotor re-assembly. The influence of this circularity change can be corrected with dynamical balancing.
The static circularity measured by wire before the commissioning tests was in 2.18 % (OEM data). These are the numbers after the re-assembly but before the first run. During the first run (mechanical rotation + excitation) – the rotor circularity has changed and after a couple of runs it stabilized at ~5 %, which is acceptable.
The rotor (and stator) concentricities were significantly improved. This also means that stresses in the rotor regions with the tangential keys will be significantly reduced and, therefore, it is expected that the machine will be more stable now. The largest stresses on a key were when the rotor bending was the largest and the smallest stresses were when the bending was the smallest (half a period later). This continuous cycling during operation caused the keys to eventually loosen and fall out.
As for stator shape, it remained the same before and after the overhaul and this is due to the fact that, during the overhaul, no actions were performed for this to be corrected. The difference in numbers (9.6 % to 11.1 %) is, probably, related to the thermal state the data was captured in (since the stator shape changes with thermal influences).
2.3 COMMISSIONING DATA
The unit was commissioned and returned to service at the end of August 2016. In this period: slow-roll, overspeed, excitation and load rejection tests were performed. In the next sections the data is analyzed for the most interesting regime, which is the overspeed.
2.3.1 OVERSPEED TESTS
One of the important tests that was performed during unit commissioning was the unit’s overspeed test. It was performed after the overhaul (at the end of August 2016). This unit is a shrink fit rim and the main questions were:
- Does the rim float at any speed reached during the experiment?
- Does the rim return to its original position after the overspeed event?
Proofs were searched in the trends of parameters relevant for loose rim detection and rotor shape for various rotational speeds.
2.3.1.1 LOOSE RIM DETECTION PARAMETERS
When analyzing data for a given air gap signal there are a number of parameters that can be calculated at any given point in time. Typically, analog data from the air-gap signals is acquired so that a couple of rotations are analyzed. Using a trigger signal and knowing what the number of pole after the trigger is – one can obtain minimum air gap values for each pole.
Since this is a 84 pole machine one obtains 84 air gap values for each of them. From these 84 values average (DC) value can be calculated as well as minimum (Min) and maximum (Max) value. One, therefore obtains:
- DC from all pole air gap minimum values (DCExtremaMin)
- Min from all pole air gap minimum values (MinExtremaMin)
- Max from all pole air gap minimum values (MaxExtremaMin)
These are important as they are good indicators for rim looseness and from them one can conclude whether or not the rim extends/shrinks uniformly during the overspeed event.
The important thing to note is that these 84 pole minimum values, obtained on each air gap sensor, contain information on both the rotor shape but also on vibrations inside the air gap (the rotor moves with precession proportional to the amount of unbalance). Therefore – when analyzing data, care should be taken to extract only the relevant information – which, in this case, are those related to the rotor shape since the intention is to monitor its change during the overspeed. Namely, it’s important to observe whether or not the rotor shape is changing (extending/shrinking) uniformly during overspeed (due to centrifugal force) or if there are rotor rim sections which are expanding more indicating looseness.
CoDiS-PDS enables vibration compensation thus enabling real rotor shape observation in both trend and rotor/stator shape data. As examples – the data for two sensors in the upper plane and two in the lower plane were selected in overspeed event and shown as a function of rotational speed (Bode plot). The data is (for one sensor, on various rotational speeds):
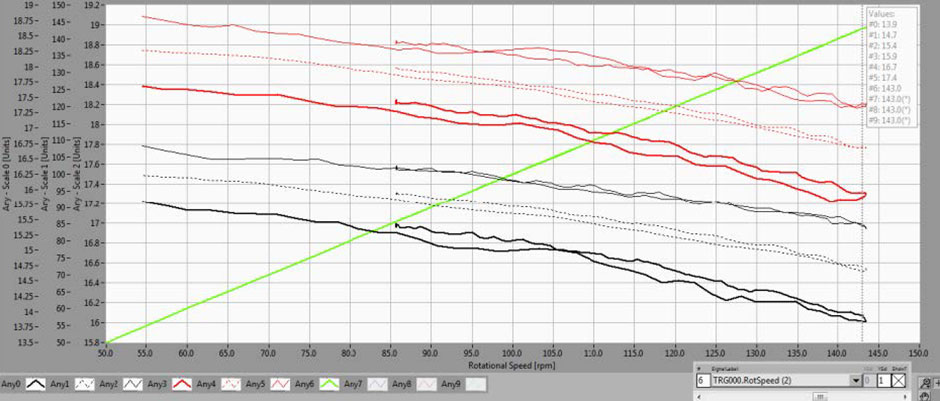
Fig. 8 MinExtremaMin, DCExtremaMin, MaxExtremaMin shown for sensors in upper plane (at MCM 0° – black; at MCM 90° – red). Vibrations not compensated in the air gap data. Scale 0 is relevant for air gap data. As the speed increases, the MinExtremaMin and MaxExtremaMin lines move further and further apart.

Fig. 9 MinExtremaMin, DCExtremaMin, MaxExtremaMin shown for sensors in upper plane (at MCM 0° – black; at MCM 90° – red). Vibrations compensated in the air gap data. Scale 0 is relevant for air gap data. As the speed increases, the MinExtremaMin and MaxExtremaMin lines remain parallel.
Fig. 8 shows the data analyzed for air gap sensors at 90° (black) and 0° (red) MCM labels without vibration compensation (raw, as measured) and Fig. 9 shows the data analyzed for air gap sensors at 90° and 0° MCM labels with vibration compensation taken into account.
What is seen comparing Fig. 8 and Fig. 9 is that on Fig. 8 the lines (MinExtremaMin and MaxExtremaMin on the same sensor) are not parallel and are becoming further apart when the rotational speed increases. In this case, the reason is that there exist vibrations (precession) of the rotor within the air gap and this precession influences the parameters being calculated. That is – in the air gap signal, there is one part of the signal which is related to the rotor geometry and the other part which is related to the rotor vibrations within the air gap. If compensation for vibrations can be done – this would give a direct insight into the rotor shape (geometry) and how it changes during the overspeed event.
CoDiS-PDS supports this compensation (data on Fig. 9) and it can be seen that the lines (MinExtremaMin and MaxExtremaMin on the same sensor) are, approximately, parallel. This means that the points (poles) on the rotor with the minimum and maximum air gaps extend uniformly and is a direct indication that the rim extends/ shrinks uniformly up to 143 rpm!
Fig. 10 shows the same data in the lower air gap measurement plane. The results are similar to those shown on Fig. 9.
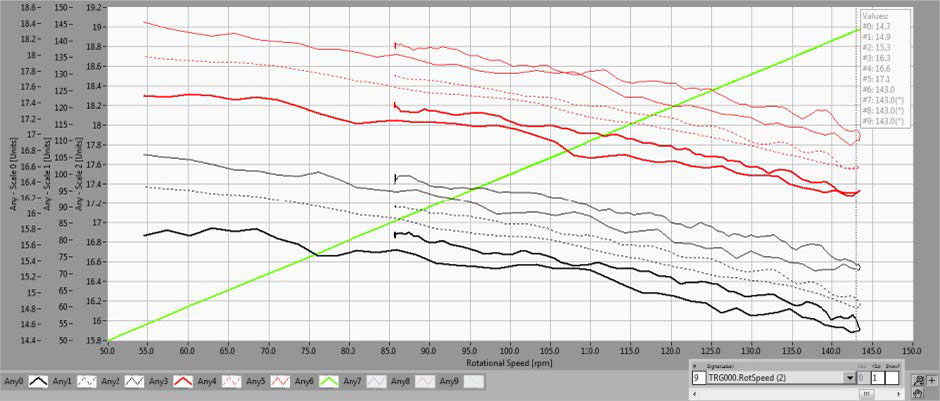
Fig. 10 MinExtremaMin, DCExtremaMin, MaxExtremaMin shown for sensors in lower plane (at MCM 0° – black; at MCM 90° – red). Vibrations compensated in the air gap data. Scale 0 is relevant for air gap data. As the speed increases, the MinExtremaMin and MaxExtremaMin lines remain parallel.
As the unit’s rotational speed increase, so do the centrifugal forces (with the square of the rotational speed). The manner and the amount by which the rotor extends are good indicators of the (possible) rotor rim flotation from the rotor spider. This can be seen from the air gap and is manifested as the air gap reduction.
From 55 rpm to 143 rpm the rotor extends, approximately, 1.4 mm which means that the rotor extends from 0 rpm to 143 rpm for ~1.64 mm. This is smaller than the 2.1 mm to which the interference between the spider and rim was designed and realized during the overhaul.
So, at 143 rpm the rotor rim is still in contact with the radial keys on all positions and that’s why the rotor extends uniformly on all sensor positions.
Additional proof that the rotor rim extends/shrinks uniformly up to ~143 rpm is given in the next section.
2.3.1.2 ROTOR SHAPE AND VIBRATIONS IN OVERSPEED
During the overspeed event in mechanical rotation, vibration data was captured for different rotational speeds. The rotational speed trend is shown on Fig. 11.
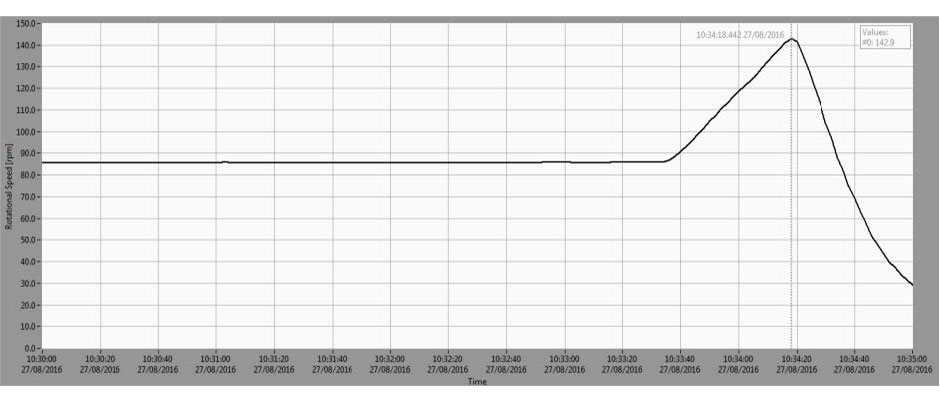
Fig. 11 Rotational speed trend during overspeed tests (recorded on on August 27th 2016).
Since the vibrations at the frequency of rotation are dominant, it is useful to plot the amplitude (peak) of the first harmonic (1x) for the same timeframe. This is shown on Fig. 12 for both relative vibration (dotted lines) and air gap (full lines) sensors in the direction 0 deg and on Fig. 13 in the direction 90 deg (check Fig. 2 for directions).
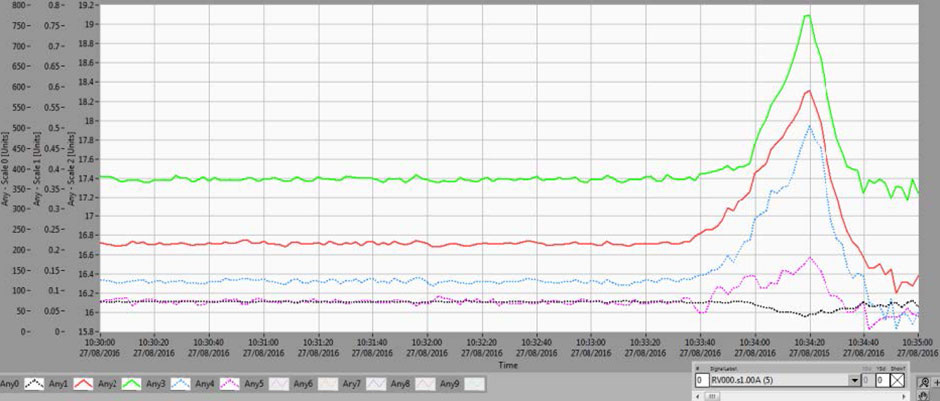
Fig. 12 Direction 0 deg: Amplitude of the first harmonic of rotational speed: UGB – 0 deg [μm] – Scale 0 (black dotted line), AG – UP – 0 deg [mm] – Scale 1 (red line), AG – DOWN – 0 deg [mm] – Scale 1 (green line), ThrB – 0 deg [μm] – Scale 0 (blue dotted line), TGB – 0 deg [μm] – Scale 1 (purple dotted line).
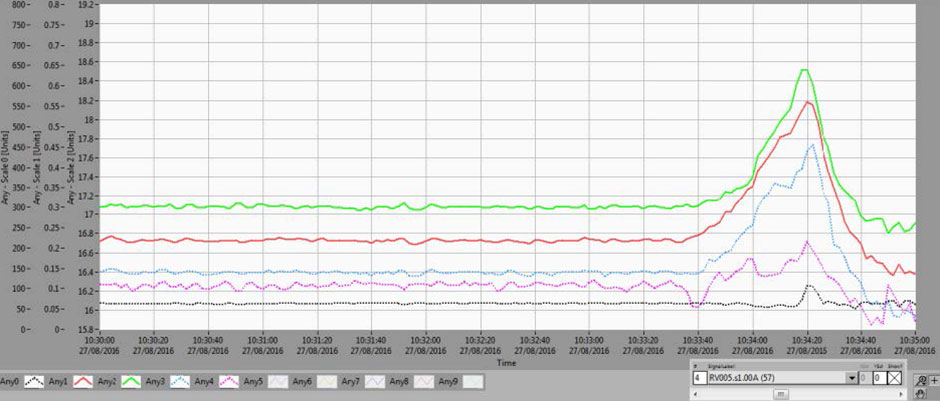
Fig. 13 Direction 90 deg: Amplitude of the first harmonic of rotational speed: UGB – 90 deg [μm] – Scale 0 (black dotted line), AG – UP – 90 deg [mm] – Scale 1 (red line), AG – DOWN – 90 deg [mm] – Scale 1 (green line), ThrB – 90 deg [μm] – Scale 0 (blue dotted line), TGB – 90 deg [μm] – Scale 1 (purple dotted line).
What is visible from those two figures is that, for low rotational speed, vibration within the bearings decrease to relatively small values (~50 μm) which is an indicator that the rotor is aligned correctly, that is, there is a small, but tolerable run-out.
On the other hand as the rotational speed decreases – vibrations within the air gap on the upper plane (red) reach ~0.135 mm (average of both figures) and on the lower plane (green) ~0.303 mm at ~24.3 rpm. What this means is that the rotor is attached to the spider with a certain amount of eccentricity. The reason for the small (but non-zero) 1x value doesn’t originate from the vibrations as the centrifugal forces are small at low speeds and, therefore, the vibrations due to the mechanical unbalance are as well. The reason for the 1x value is eccentricity.
A good way to visualize how the rotor dynamical shape changes with rotational speed is to show it in “3D” (Fig. 14). What is drawn are the 1x orbits for all measured planes – including bearing planes and air gap measurement planes. Using CoDiS-PDS software – vibrations were extracted from the air gap signals and visualized here. The planes are the same as those indicated on Fig. 2 (LEFT).
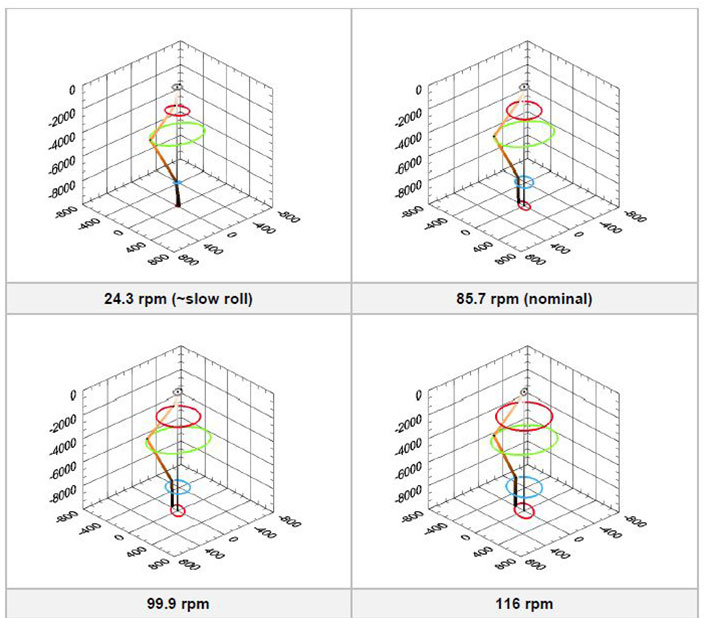
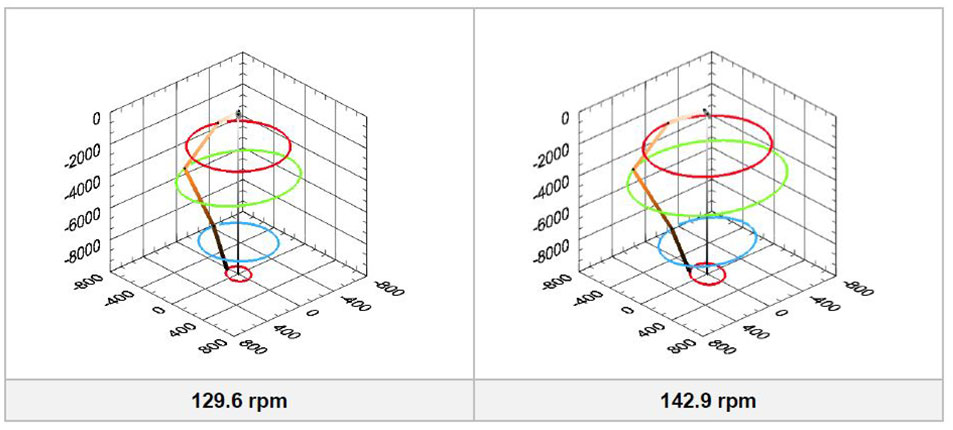
Fig. 14 3D Dynamical rotor line from data on 24.3, 85.8, 99.9, 116.0, 129.6 and 142.9 rpm. The planes are (UP to DOWN, respectively): UGB, AG – UP, AG – DOWN, ThrB, TGB. Amplitude and phase data from sensors in 0° and 90° directions was used to produce the figures.
To visualize rotor (and stator) shapes, along with their concentricities/circularities during the overspeed event it is beneficial to analyze the data at different rotational speeds. Data for five different rotational speeds were taken and stator/rotor shape drawn. This is shown on Fig. 15.
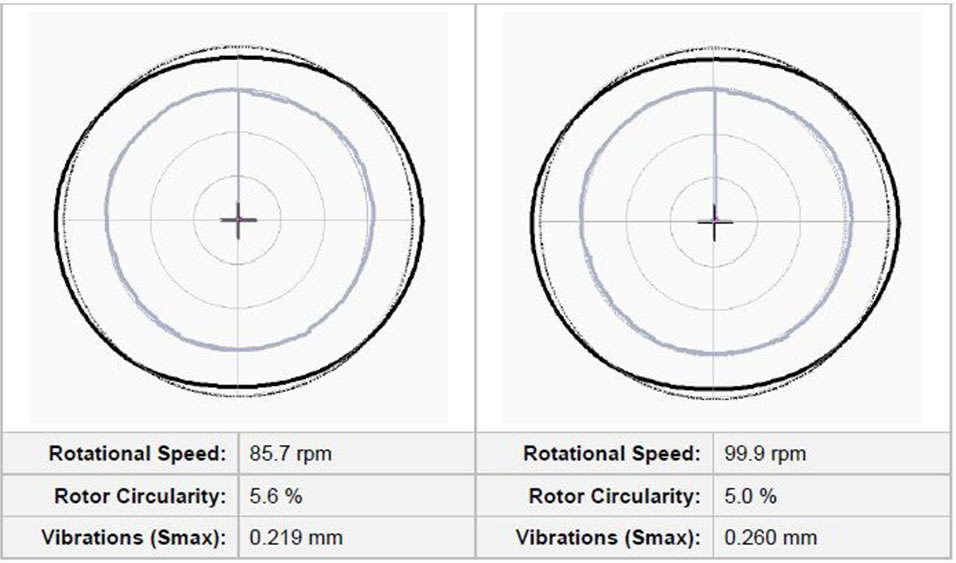
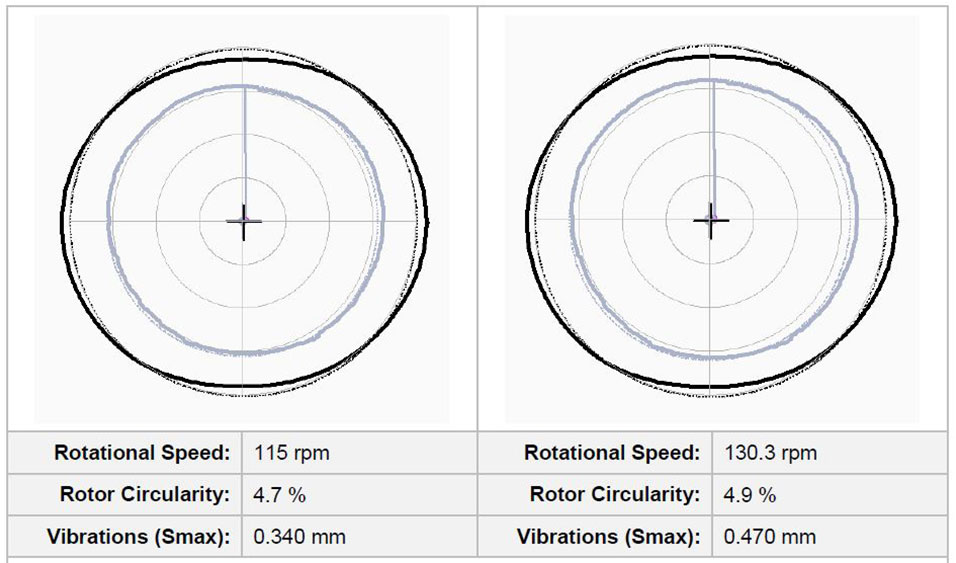
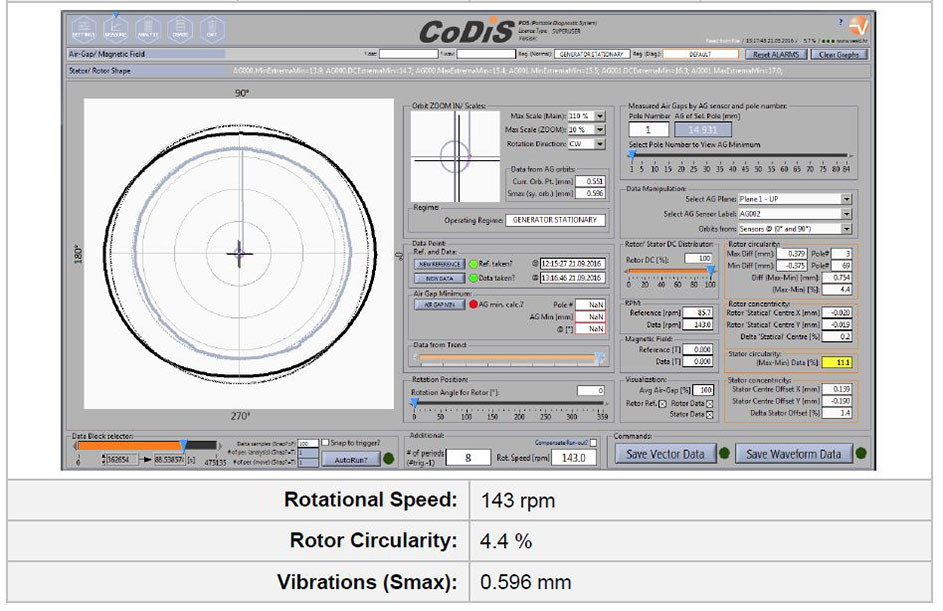
Fig. 15 Rotor (and stator) shape during overspeed test. Rotational speed, rotor circularity and vibrations inside the air gap are indicated below each figure. Reference data is taken at nominal speed (85.7 rpm).
From the figure it can be seen how the rotor shape changes from ~5.6 % (at 85.7 rpm) to ~4.4 % (at 143.0 rpm). The vibrations inside the air gap increase from ~0.219 mm (at 85.7 rpm) to ~0.596 mm (at 143.0 rpm).
The data for rotor shape is shown as a bar plot for two sensors in the upper plane: AG000 (MCM 0°) and AG002 (MCM 90°) – Fig. 16.
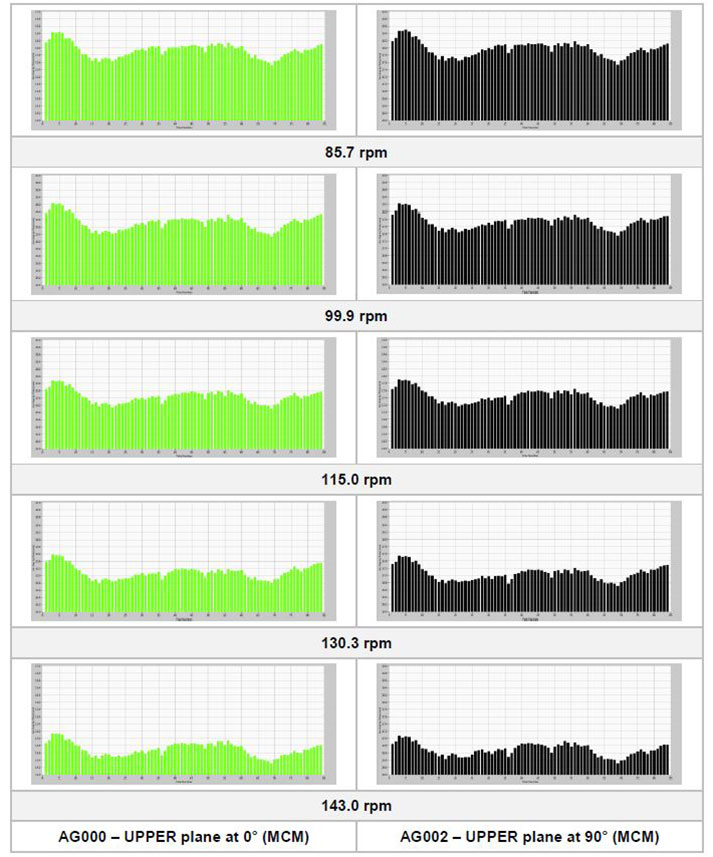
Fig. 16 Bar plots indicating real rotor shape (vibrations compensated in the air gap) for two sensors at upper plane: AG000 – UPPER plane at 0° (MCM) and AG002 – UPPER plane at 90° (MCM).
From the bar plots in Fig. 16 the first thing that can be seen that the air gap reduces (for each pole) when the rotational speed increases. This is due to the fact that the centrifugal force extends the rim radially therefore reducing the air gap. The other thing to notice is that the rotor shape remains roughly the same for all rotational speeds. When comparing bar graphs for the same sensor at different rotational speeds it is seen that the same shape shifts indicating that there are no rim sections which extend more than the other.
Therefore– the rim extends/ shrinks uniformly for an overspeed event up to ~143 rpm.
3 CONCLUSIONS
From the root cause analysis it was established that the tangential keys detached due to the large stator to rotor eccentricity causing the keys to experience cycling stresses. The largest stresses on a key were when the rotor bending was the largest and the smallest stresses were when the bending was the smallest (half a period later). This continuous cycling during operation caused the keys to eventually loosen and fall out.
From the relative vibration and air gap analyses taken from the monitoring system, the following can be concluded:
Conclusions:
- eccentricity for the unit was significantly reduced during the overhaul and therefore the stresses in the rotor regions with the tangential keys were significantly reduced
- the rotor rim extends uniformly for an overspeed event up to ~143 rpm
Recommendations:
- it’s recommended that the unit is dynamically balanced in two planes so that the first balancing plane is UGB and the second is ThrB plane; it’s recommended that the vibrations on TGB – 90° be reduced ~100 μm peak-to-peak
4 REFERENCES
[1] C. M. Harris, A. G. Piersol: Harris shock and vibration handbook, McGraw Hill, 2002
[2] ISO 7919-1: 1996: Mechanical vibration of non-reciprocating machines –Measurements on rotating shafts and evaluation criteria; Part 1: General guidelines 1996
[3] ISO 7919-5:2005, Mechanical vibration of non-reciprocating machines – Measurements on rotating shafts and evaluation criteria – Part 5: Machines sets in hydraulic power generating and pumping plants, ISO, 2005
[4] ISO 10816-1:2000; Mechanical vibration Evaluation of machine vibration by measurements on non-rotating parts; Part 1: General guidelines, 2000
[5] ISO 10816-5:2000, Mechanical vibration — Evaluation of machine vibration by measurements on non- rotating parts – Part 5: Machine sets in hydraulic power generating and pumping plants, ISO, 2000
[6] J. P. Den Hartog, Mechanical Vibrations, McGraw Hill, 1956
5 AUTHOR BIOGRAPHIES
Ozren Husnjak:
Education: Master of Science at Department of Physics, Faculty of Science in Zagreb
Working experience: Four years (2002.- 2006.) employed as an assistant at Department of Physics involved in experimental laboratory research on superconductivity.
Last 10 years (2006.-) employed at Veski on software development, vibration troubleshooting and problem solving. Ozren worked on numerous Machine Condition Monitoring projects as system commissioning engineer and as a technical expert for machine condition evaluation.
Ozren Oreskovic:
Education: Master degree at Faculty of Mechanical Engineering and Naval Architecture in Zagreb
Working experience: over 11 years of experience, employed at Veski.
From 2004-2009 Worked as Field Service Engineer commissioning Machine Condition Monitoring systems and troubleshooting vibration problems on rotating machines.
From 2009-2012– Working as Sales and Marketing manager at Veski
From 2012 – Works as Managing director at Veski
Tihomir Tonkovic:
Tihomir Tonkovic is a graduate of the Faculty of electrical engineering and Computing in Zagreb. He has 7 years of work experience. He works at Krovel in Zagreb as a system engineer from 2009. to 2011. From 2011 he works in Veski as a R&D engineer developing CoDiS platform and as a field engineer doing vibration measurements and analysis.
Renato Vargas del Frari:
Mechanical Maintenance Engineer at Engie Brazil Energy responsible for maintenance engineering on Synchronous Machines for hydro power plants and hydromechanical equipment. His experience of 6 years in this field comprises commissioning of new plants, efficiency tests (ISO 60034-2A), development of preventive maintenance planning on hydro generators, hydro power plants long term investment planning and modernization. Renato is graduated in Mechanical Engineer at Passo Fundo University (UPF) with specialization in Project Management at Fundação Getúlio Vargas (FGV).
Paulo Henrique Santos Feitosa:
Paulo Feitosa is a Senior Maintenance Engineer at Engie Brazil Energy responsible for maintenance engineering on Synchronous Machines for hydro power plants. His experience of 10 years in this field comprises repair techniques for recovering failures in stator magnetic core and windings, commissioning of new plants, development of preventive maintenance planning on hydrogenerators, hydro power plants long term investment planning and modernization. Feitosa is graduated in Electrical Engineer with specialization in Electrical Power Systems from Itajubá Federal University in Brazil.
John Letal:
John Letal is a Rotating Machines Engineer at Iris Power responsible for supporting rotating machine mechanical monitoring initiatives. Prior to Iris, he spent most of his career as a Field Service Engineer troubleshooting large rotating equipment using such tools as vibration analysis, force response measurements, modal analysis, as well as the implementation and execution of vibration analysis programs. John holds a Master of Engineering degree in Mechanical Engineering from the University of Toronto and is registered as a Professional Engineer.