
1. INTRODUCTION
Two Francis turbine powered hydro units, 31 MW each are installed in Jajce 1 hydro Power Plant. Net head is 92.5 m and the rotational speed 300 rpm with the 37 m3/s flow per unit. Very large vibrations have been noticed on Unit 1. For this reason – measurements to reveal the vibration root causes have been performed and adequate overhaul procedures suggested. Accurate measurement results
interpretation and problem diagnostics are of crucial importance for successful overhaul works to reduce the unit vibrations. In the following chapters – the measurement procedures with the most important measurement results and diagnostics have been described along with the most important overhaul procedures.
2. MEASUREMENT PROCEDURES
Measurements were performed using the 16 channel portable vibration measurement system CoDiS-PDS (Computerized Diagnostic System – Portable Data System). This system was chosen because, beside standard options, it has additional expert options specifically designed to be used for hydro units. Here is a list of some standard and additional options.
STANDARD OPTIONS:
- configurable channel sensitivity/ offset (adjusting to the sensors used)
- integrate/differentiate signal 1x, 2x
- history trend analysis: continuous calculation and trending of all relevant vibration parameters including order analysis
- on-line short term trends
- configurable analysis parameters for each calculated value (filtering, gliding)
- recording/ analysis of waveform (raw) data
- spectra (FFT and waterfall/ intensity plot)
- orbit analysis
- Bode, Nyquist, shaft centerline plot
ADDITIONAL OPTIONS:
- air-gap and magnetic field analyses (rotor/ stator polar plots etc.) – stator/ rotor concentricity and circularity
- slow roll vector analysis to assess shaft alignment at very low rotational speed (practically to unit stop) – 3D Run Out module
- orbits: unaveraged/ averaged + glided/ synthesized with/ without DC (statical shaft position)
- dynamical rotor line
- one and two-plane balancing
Example screens for these are given in Fig. 1
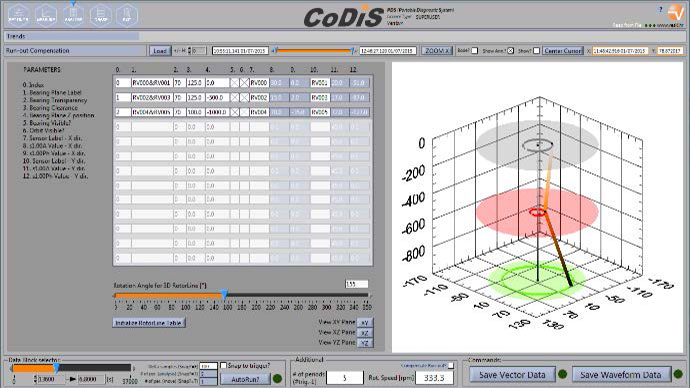
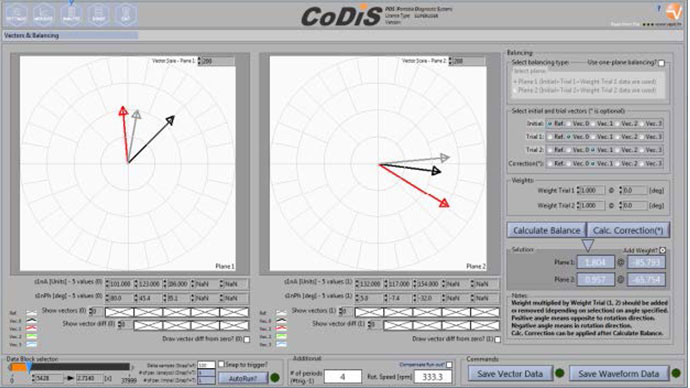
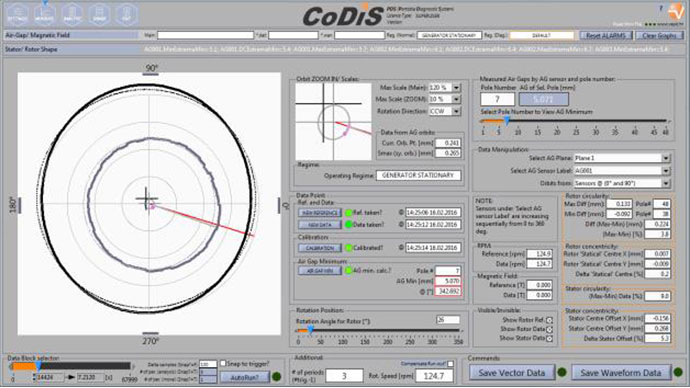
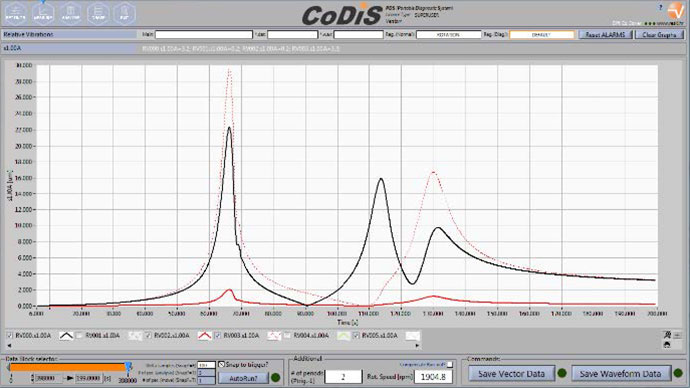
Fig. 1 Example screens from expert modules enabling additional analyses.
Sensors that were used included:
- 1x rotational speed signal (a signal which is also used as a phase reference and which produces one impulse per shaft revolution)
- 6x relative vibration sensors (displacement sensors) – two mutually perpendicular sensors per bearing plane measuring shaft displacement relative to the bearing housing
- 6x absolute vibration sensors (accelerometers) – two mutually perpendicular sensors per bearing plane placed on bearing housing measuring its vibrations
- 1x axial shaft position (displacement sensor) measuring shaft movement in axial (in this case vertical) direction
Signals from the accelerometers were integrated into the vibrational velocity which is typically used in the analysis and measurement results presentation and on which the ISO vibrations standards are based.
The directions in which the displacement and acceleration sensors were placed are denoted on Fig. 2.
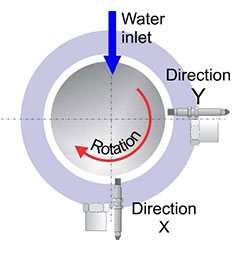
Fig. 2 Measurement layout for relative and absolute vibration sensors. Direction X is at 180° and direction Y at 90° with regards to the water direction (in the rotation direction). Top view.
The bearings are: UGB – Upper Guide Bearing, LGB – Lower Guide Bearing and TGB – Turbine Guide Bearing. The thrust bearing is of the combined type and is integrated with the UGB into one housing. Fig. 3 shows the sensors at TGB level along with the laptop used for the measurements.
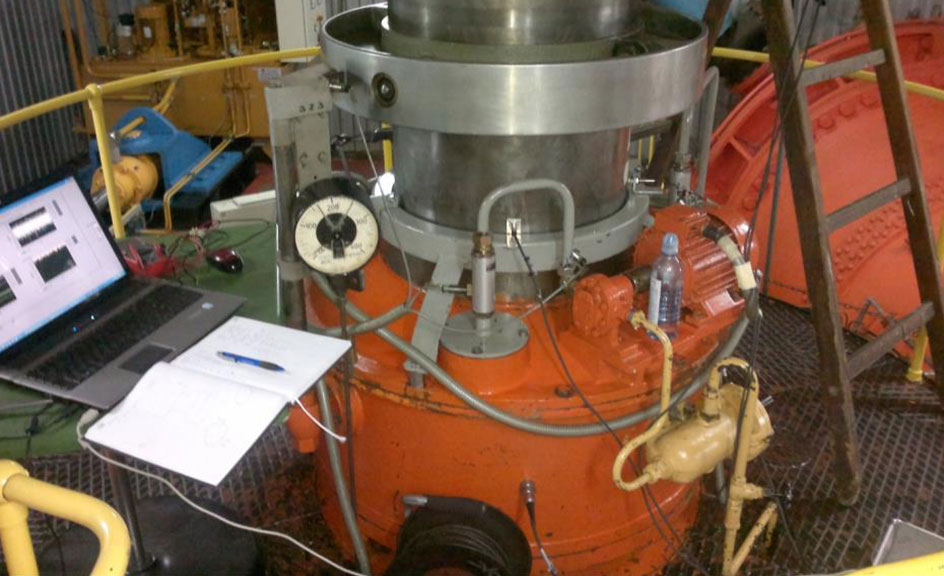
Fig. 3 Sensors at TGB along with the laptop used for measurements.
Additionally, for the measurements in which the rotor dynamical line was established – the sensors were placed in different planes along the unit’s vertical (axial) direction. One example is given on Fig. 4 (for sensors placed under UGB under the thrust collar).
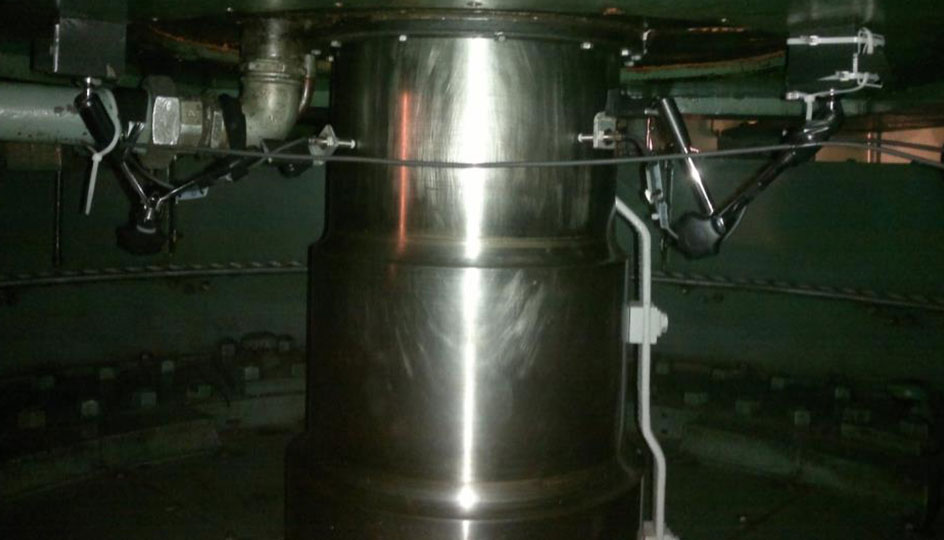
Fig. 4 Sensors under UGB (and under the thrust collar).
All relevant vibrational representatives (Smax, order analysis (1x, 2x, 3x harmonic, Rest), statical positions from relative vibration sensors and RMS, order analysis from absolute vibration sensors) were calculated continuously and trended. Additionally, on user request and/or alarm – raw waveforms were stored which enabled additional data analyses.
3. MEASUREMENTS
A. MEASUREMENTS IN APRIL 2012
The detailed vibration measurements on Unit 1 were performed in April 2012. (on 25. and 26.04.2012.).
On 25.04.2012. the test which included the following regimes was performed: run-up, automatic excitation (at approximately the nominal rotational speed – around 15:33 h), synchronization and load increase to 25, 50, 75 and 100% load.
After frequency (order) analysis was performed it was determined that the main contribution to the overall vibrations originates from the first harmonic of rotational speed.
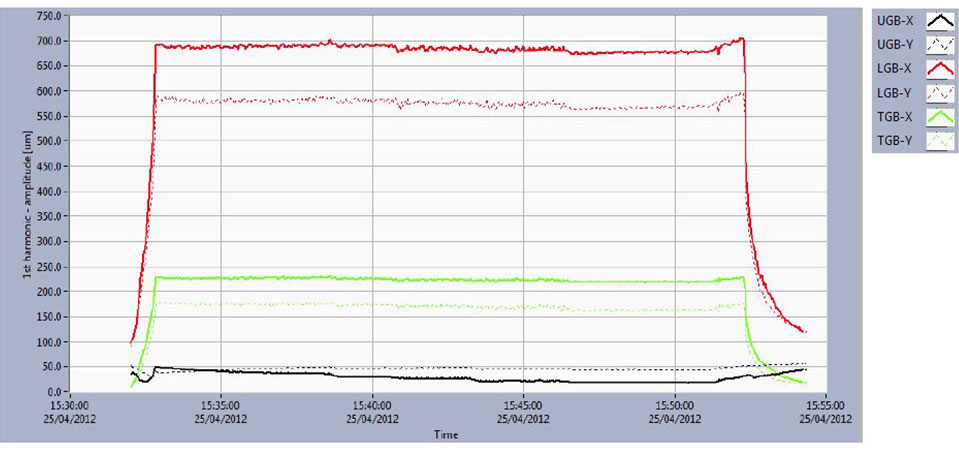
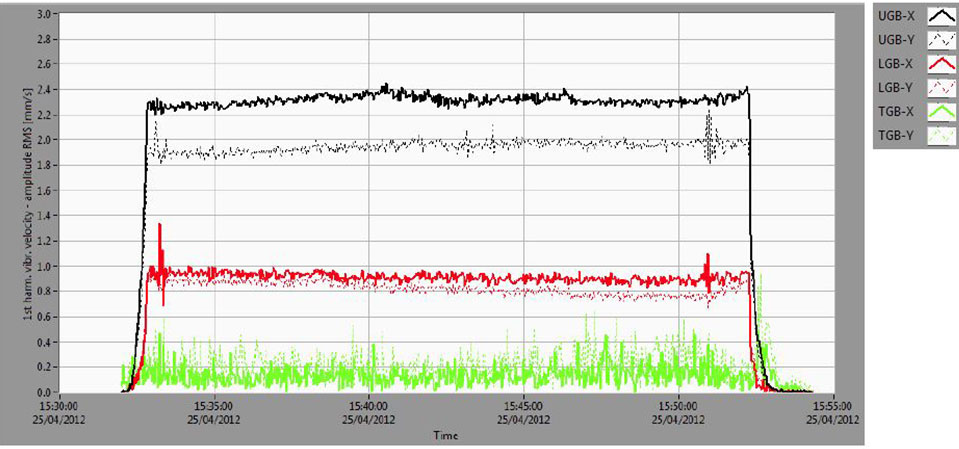
Fig. 5 Upper diagram: Trend of first harmonic peak amplitude for shaft displacement. Lower diagram: Trend of first harmonic rms amplitude for bearing housing vibrations.
For this reason – all of the following analyses refer to this parameter. It is directly comparable (although slightly smaller) to Smax value given by the ISO standards. Fig. 5 shows the trend of first harmonic amplitude peak for relative shaft displacements and first harmonic amplitude rms for absolute housing vibrations.
From Fig. 5 it can be seen that the LGB relative vibrations in both directions X and Y are outside the allowed values recommended by the standards (ISO 7919-5:2005 – see Fig. 6) and also outside the one-sided clearance which is set to ~0.22 mm. For example – the boundary between zones C/D1 for 300 rpm machines is at 270 μm and the amplitude peak vibrations on LGB are above 700 μm! It would be very dangerous to run this machine for a longer time as it could lead to its catastrophic failure.
Note that the 700 μm is even above the diagram visible area (Fig. 6)!
1 Zone D: Vibration levels in this zone indicate that there is a high probability of damage to the machine. For this reason – immediate action is required to identify the reasons for the high level of vibration.
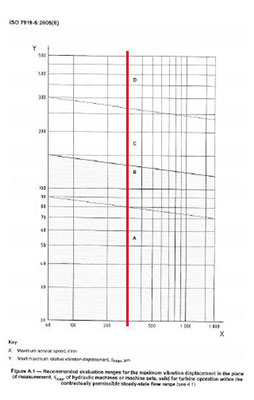
Fig. 6 ISO 7919-5 standard for relative shaft vibrations. Zones of operation based on Smax are shown. Rotational speed for HPP Jajce 1 is indicated.
Since the unit was automatically excited, which happens very quickly after reaching nominal speed – this trend doesn’t show clearly the differences between vibrations in mechanical rotation at nominal rotational speed without excitation and with the excitation turned on (field flash). But a more detailed analysis showed that there actually exists a significant change in the amplitudes (and slightly in phases too) of the first harmonic when comparing mechanical rotation without excitation to mechanical rotation with excitation. This data is shown in Table 1.
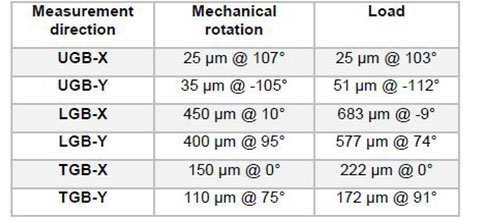
Table 1 Amplitudes (peak) and phases of the first harmonic of rotational speed.
So, there exist two types of unbalances: mechanical unbalance and with excitation and load increase also magnetic unbalance. The vibrations increase in amplitudes but change only slightly in the phases.
The shaft displacements relative to the bearing housing at UGB are very small (black lines on Fig. 5 – upper diagram), but at the same time the bearing housing absolute vibrations at UGB are between 1.9 and 2.4 mm/s (these are the first harmonic rms values, that is values at 5 Hz) depending on the direction viewed. This indicates shaft tension in the UGB zone where the forces are transferred through the oil-film to the bearing housing. If the shaft was in the bearing center – for measured displacements – the vibrations on the bearing housing would also be small, especially at the first harmonic. This is not the case here.
Since the displacements on LGB are larger than the bearing clearance and vibrations on bearing housing are relatively small (under 1 mm/s for amplitude rms of the first harmonic of the vibrational velocity) one can conclude that the large forces between the shaft and the LGB segments have ‘widened’ the LGB clearance due to the fact that the shaft created extra space to vibrate within. Such a situation produces a great stress on the LGB construction. Housing vibrations are not as large since the LGB construction is very stiff and these forces are (through the LGB construction) transferred directly to the foundation.
Such a disproportion between the displacements and absolute vibrations of bearing housing on UGB and LGB suggests there are also problems with the fact that shaft and bearing are being misaligned.
Large shaft displacements in the TGB plane are a direct consequence of the LGB vibrations, that is, the vibrational displacements in the LGB zone are transferred to the TGB through the shaft.
Based on these measurements – basic overhaul procedures were proposed to improve the unit’s vibrational state. When the unit was stopped before the (first) overhaul, it was found that LGB bearing was damaged and that the one-sided clearances were increased to ~0.5 mm when compared to the nominal values (~0.22 mm). Overhaul was performed in 2012. During this overhaul, the LGB was repaired and set to its nominal (~0.22 mm – one sided) clearance. But, unfortunately – the problem of forces originating from the rotor was not solved by these actions as the state begun to deteriorate (vibrations started to increase). New measurements were performed with the purpose to solve unit’s vibrational problems once and for all.
These measurements are described in the following chapter (chapter 3.B).
B. MEASUREMENTS IN JUNE 2013 (BEFORE OVERHAUL #2)
The measurements were performed on 18.06. and 19.06.2013. The basic measurement layout is the same as for measurements in 2012. (described in chapter 3.A). Measurement description and sensor layout are given in chapter 2.
Measurements program was based on the measurements from 2012. but, additionally, the measurement focus was set to the determination of the rotor dynamical line. The rotor dynamical line is a useful tool that’s used to identify forces accumulated in the rotor. That’s why, beside the basic measurement layout as seen on Fig. 2, additional measurements were performed in such a way that the sensors from UGB were moved to the new locations in the vertical direction to cover additional measurement planes. The following positions were covered:
I. UGB just above thrust collar, below the slip rings
II. UGB above the slip rings (about 0.5 m above the previous position) – practically at the shaft end
III. UGB below thrust collar (at the position where the shaft exits the thrust bearing)
IV. sensors from UGB were moved to the coupling from the generator side
V. sensors from UGB were moved to the coupling from the turbine side
The purpose of these measurements was to identify how the shaft behaves within the thrust collar, that is, what is the quality of their overlap and whether or not they move relative to one another. Also to establish how the shaft and thrust collar behave within the UGB segments.
For all measurements – the sensors were placed in the X and Y directions as shown on Fig. 2, but in different vertically positioned measurement planes.
I. UGB just above thrust collar, below slip rings
The measurements lasted a couple of hours from run-up, (automatic) excitation, rotational speed change of excited unit (Fig. 7). After the excited unit rotated a couple of hours – it was synchronized and load increased to maximum (30 MW). The rotation in this regime lasted the next two hours until the temperature stabilized.
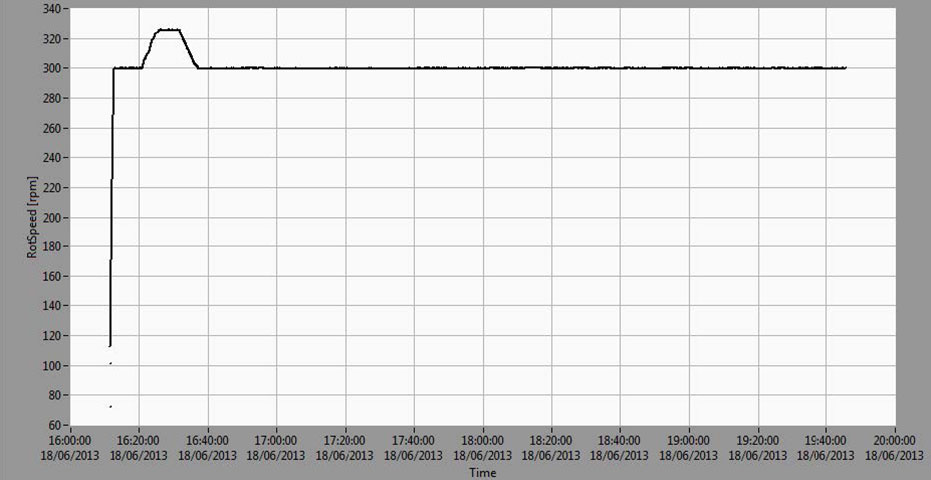

Fig. 7 Rotational speed trend during the measurements (upper diagram). Trend of first harmonic peak amplitude for shaft displacement. UGB-X and UGB-Y at the position above thrust collar, below slip rings (middle diagram). Trend of first harmonic rms amplitude for absolute vibrations (lower diagram).
Similar to the measurements from 2012. (chapter 3.A) it was noticed that the first harmonic of rotational speed has the most important contribution to the overall relative vibrations. It’s also interesting for diagnostic purposes since it enables the analyses of vibration amplitude + phase relations at different measurement positions. The phase relations are essential for adequate rotor dynamical line identification.
What do the results shown on Fig. 7 show?
First of all – it can be seen that the vibration amplitudes change significantly with the regime changes, especially for LGB vibrations, which are at the limit of allowed values even for short-term operation (according to ISO 7919-5 the C/D zone limit is ~270 μm). At the beggining of the recording, the amplitudes peak of the first harmonic (which are practically identical to Smax) reach ~210 μm on the LGB. Unit was already automatically excited at this point. After that, for a short time – the rotational speed was increased to ~330 rpm. Vibrations increased to ~250 μm thus indicating that they vary significantly with the regime changes.
It can also be seen from the diagrams that the vibrations for rotation with excitation and later with load increase continually. After approximately 4 hours they reach ~270 μm. It can be evaluated that they would, after approximately, 2 hours reach 280-290 μm. Those numbers are unacceptable for the long-term operation. The vibrations on UGB and TGB are a couple of times smaller and do not vary as much with regime changes (except rotational speed change).
The absolute bearing vibrations are below ~0.8 mm/s (first harmonic, rms). For slow-speed machines such as that in HPP Jajce 1 – the absolute vibrations can serve as an indicator of the overall vibrational state but will rarely reach values unallowed by currently valid standards (ISO 10816-5).
One interesting fact can be seen from the diagrams. For similar absolute vibrations measured on bearing housings (0.4-0.6 mm/s) the amplitudes of UGB and LGB relative vibrations are significantly different, that is, the ratio LGB/UGB is ~4. If the nominal clearances for UGB and LGB were set to similar values during overhaul, it is evident that after the overhaul the bearing clearance on UGB is significantly smaller than that on LGB which is why on UGB the relative shaft vibrations with the same values cannot develop with the same values as on LGB. It can be concluded that the shaft is „leaning“ to the one side and on this side – the bearing clearance is significantly smaller. Due to this – the oil film stiffness is significantly increased and the vibration amplitudes are smaller. So, similar to the state from April 2012, the shaft and bearing misalignment problem remains.
That is, although there are differences in the amplitudes between the measurements in June 2013 and April 2012, those results are actually very similar in its nature. The relative vibrations on LGB are a couple of times larger than on UGB, while the absolute vibrations of bearing housing on UGB are comparable to that of vibrations on LGB.
As for the turbine rotor – no overhaul works were performed on it from summer 2012 and the vibrations reduced from ~220 μm to ~60 μm. This change in vibrations is caused by the generator rotor. In 2012, the displacements of the generator rotor were so large that they pulled the turbine rotor. When the vibrations in the LGB zone were reduced, so were the vibrations in the TGB zone.
The extreme values for relative vibrations of LGB measured in April 2012 are the result of the LGB segments loosening, which was established during the overhaul in the summer of 2012. Even though the amplitudes in June 2013 are much smaller than those in April 2012, they are still in the unallowed zone.
The extreme vibrations from April 2012 were a consequence of the increased bearing clearance due to the loosening/ damage of the bearing segment fixation elements. The shaft used this space and reached vibration amplitudes which the bearing clearance allowed.
Measurements in June 2013 show that similar process takes place but with smaller amplitudes. These amplitudes are a result of the LGB (one-sided) bearing clearance being set to ~0.2 mm (a fairly common value for hydro-unit guide bearings) and the shaft vibrates with the amplitude which the bearing allows.
But, during the unit thermal expansion, the relative vibrations increase (Fig. 7 – middle diagram). This is a sure sign that the forces are accumulated inside the generator rotor due to which the vibrations reached the highest values allowed by the bearing clearance.
So during the summer 2012 overhaul, the accumulated forces inside the rotor were not eliminated but reduced by the LGB clearance reduction. So, from the measurements, it is legitimate to conclude that this state would continually deteriorate towards that measured in the April 2012.
Phase comparison shows that the vibration response remained the same if the measurements from June 2013 are compared to April 2012. In the 2012 overhaul the relative vibration amplitudes on LGB were reduced with bearing clearance reduction. This action did not eliminate forces accumulated within the rotor. To identify those forces, it is neccessary to identify rotor dynamical line. In other words – to identify shaft vibrations in different planes for different rotor shaft’s vertical (axial) measurement planes.
That’s why additional measurements were performed for the positions indicated at the beggining of this chapter (positions I through V).
What was interesting to observe is summarized in Table 2 for measurement positions I through III (in the UGB zone above and below thrust collar).
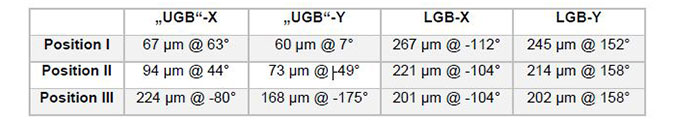
Table 2 Peak amplitudes and phases for relative shaft displacements measured at different positions (I through III) in the unit’s vertical (axial) direction. Excited state was chosen for comparison.
Sensors marked as „UGB“ were placed at different positions (I through III) during the measurements as previously described. At the same time – sensors at the LGB positions were not moved but stayed at the same location for all measurements. The vibration levels (peak amplitudes) are somewhat different for LGB depending on the machine’s temperature at the moment the data was taken. But the phases are practically the same. Contrary to this – the amplitudes on „UGB“-X and „UGB“-Y positions are increasing from position I through III and phases are changing drastically for the positions above thrust collar (positions I and II) and below thrust collar (position III).
When comparing „UGB“ to LGB vibrations it is clear from Table 2 that the vibrations under thrust collar are even larger than those at LGB (measured below LGB). And the phases are very similar indicating that the shaft vibrates almost in phase under thrust collar and at LGB position. At positions above thrust collar (I and II) the vibrations are practically out of phase to LGB.
What do these results show?
The fact that the vibration levels are smaller above thrust collar to that below it wouldn’t be possible if there was no clearance between thrust collar and shaft in the lower thrust collar zone. If the contact between thrust collar and shaft was solid – they would move as one body and this behaviour wouldn’t have been possible. Phase relations support this.
Additionally – it was noticed that the shaft statical position in the Y direction changed sharply when excitation was turned on, which is not seen at positions above thrust collar. It is clear that the shaft has greater freedom of movement below the thrust collar than above it thus supporting the loose connection between thrust collar and shaft explanation!
Measurement then continued by moving the „UGB“ sensors above (towards the generator) and below (towards the turbine) coupling (positions IV and V). The dynamical rotor line is obtained and it is shown on Fig. 8. It was noticed that these vibrations are almost identical in amplitudes and phases to the measurements at LGB (these measurement positions are ~50 cm below LGB).
Fig. 8, basically, shows the rotor vibration shape at the rotational speed. Vibration amplitudes and phases, based on which the figure was drawn were taken for the nominal speed + excited regime. It should be pointed out that the rotor dynamical line is similar in mechanical rotation but with smaller vibration amplitudes.
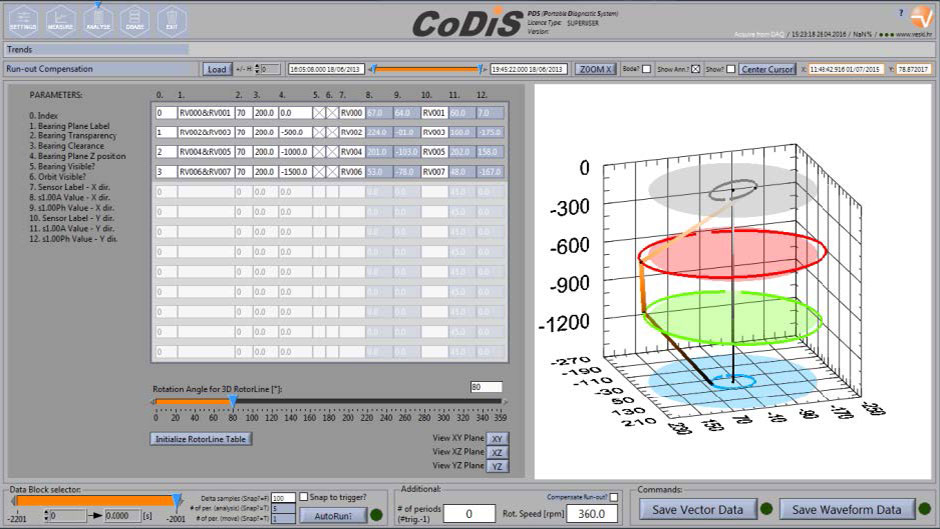
Fig. 8 Rotor dynamical line (under excitation). Top to bottom: position I, position III (as indicated in text), LGB, TGB plane.
Based on these results – the basic properties of dynamical rotor line can be established:
– the largest statical (DC) shaft deflection is at the coupling level and is, approximately, 80 μm; at UGB (at bearing segments level) and at TGB – are the positions with smallest statical deflection
– the dynamical shaft deflection up to nominal (and higher) rotational speeds increases in one direction, which is seen from the phase relations
– large shaft vibrations below thrust collar, which are out-of-phase to those above the thrust collar indicate that there is a clearance between the shaft and the collar
In July 2013 an overhaul was performed during which:
– adequate (solid) connection was established between the thrust collar and the shaft (by repairing the thrust collar)
– horizontality of the thrust collar’s runner was ensured
– shaft’s tension in the UGB zone was relaxed
– unit was balanced (weights in the LGB plane are shown in Fig. 9)
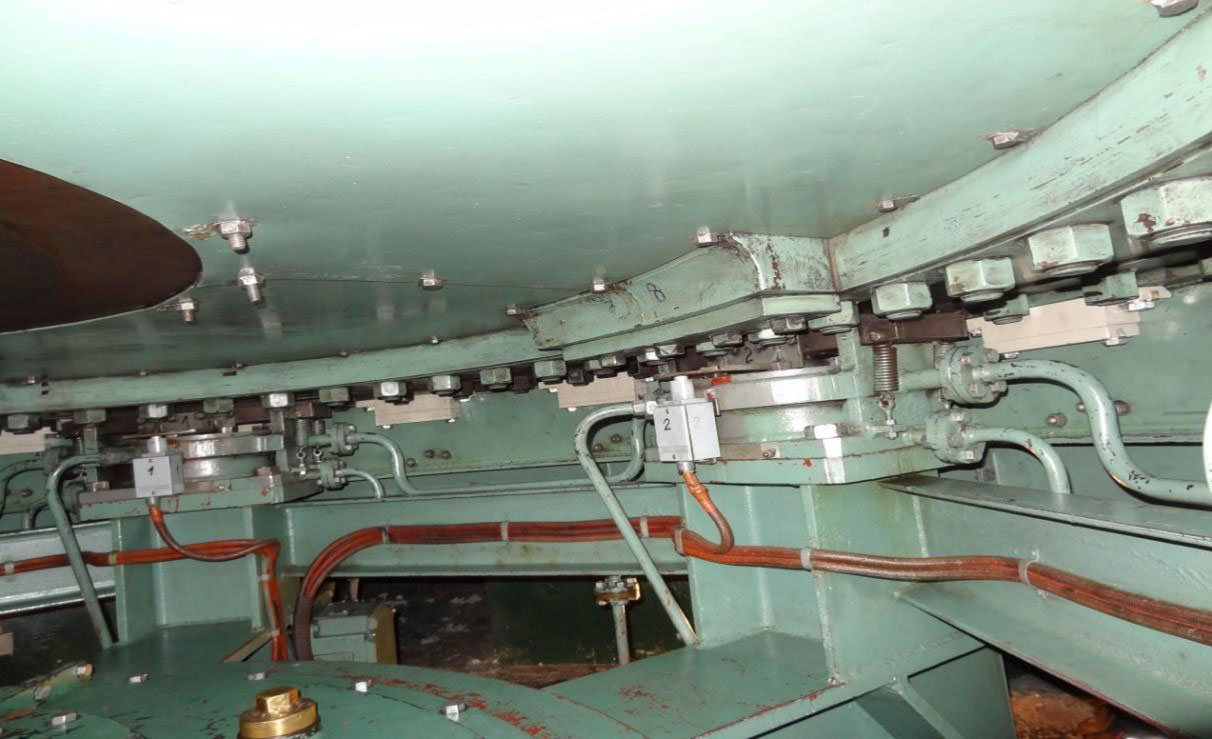
Fig. 9 Balancing weights under the generator (in the LGB zone)
After the overhaul, measurements were performed to check the unbalance and vibration changes with thermal influences.
C. MEASUREMENTS IN JULY 2013 (AFTER OVERHAUL #2)
The measurements were performed with the layout given in chapter 2. After balancing in mechanical rotation, vibrations during excitation and load increase were recorded. The regime was the following: run-up with automatic excitation, rotation with excitation on for ~10 minutes followed by synchronization and load increase up to 20 MW. Rotation for ~1 hour under those conditions followed by load increase to ~29 MW which lasted for ~1 hour. The results for relative shaft vibrations are shown on Fig. 10.
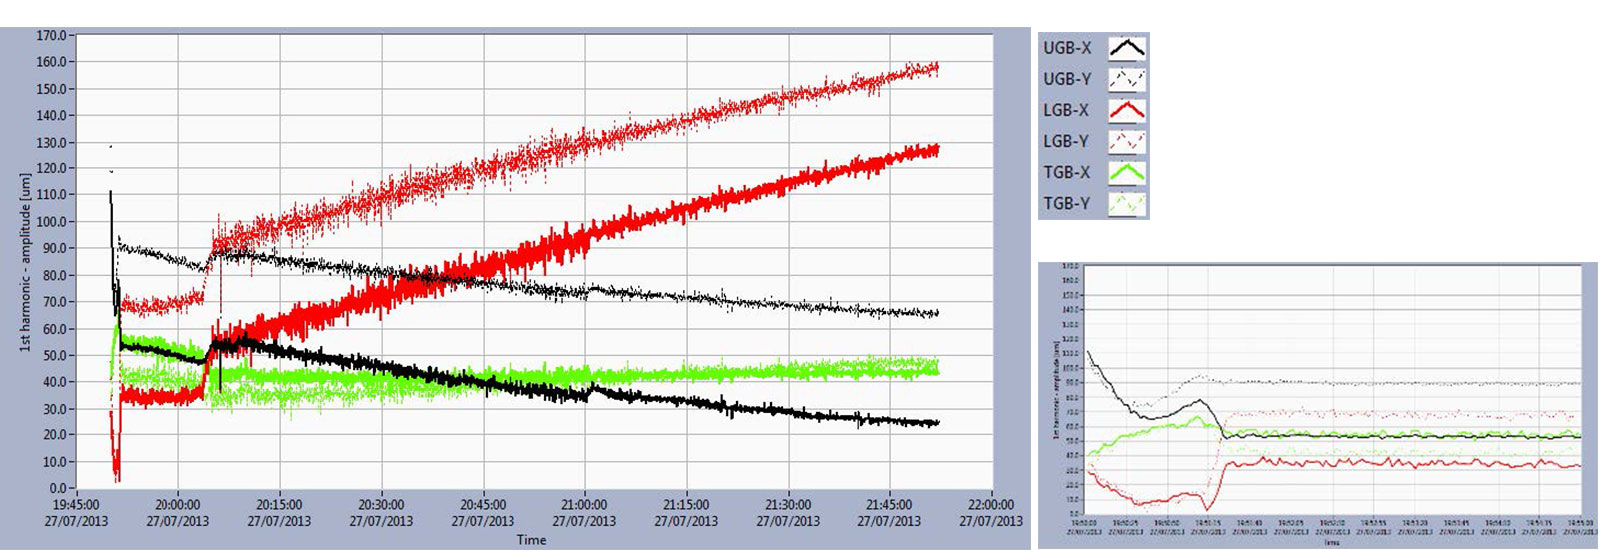
Fig. 10 Trend of first harmonic peak amplitude for shaft displacement. Small figure is zoomed in figure to compare the vibrations in mechanical rotation to that in excited state.
From the zoomed in part of the Fig. 10 it can be seen that the vibrations in mechanical rotation are significantly reduced. For example, on LGB they are 10-15 μm. After the excitation is turned on, the vibrations in the LGB-X direction increased to 35 μm and in the LGB-Y direction to 70 μm. Those are acceptable values and if they remained at these levels at maximum load – the problem with vibrations would have been solved already.
Unfortunately, after synchronization and load increase to 20 MW the vibrations increased to 60 μm in the LGB-X direction and to 100 μm in the LGB-Y direction and within the next two hours continuously increased further. After approximately one hour (around 21:00 h) the load was increased to 29 MW which had no influence on the vibration trends. The trend slope indicates that the vibrations would saturate at ~190-200 μm.
This is unacceptable and, in order to ensure that the unit operates within acceptable vibration limits, it is neccessary to re-distribute the influence of excitation and thermal rotor deformations so that in all regimes the values are around 100 μm (50% of bearing clearance). This was achieved with adequate balancing weights distribution.
After several iterations vibrations were recorded again and the results are shown on Fig. 11.
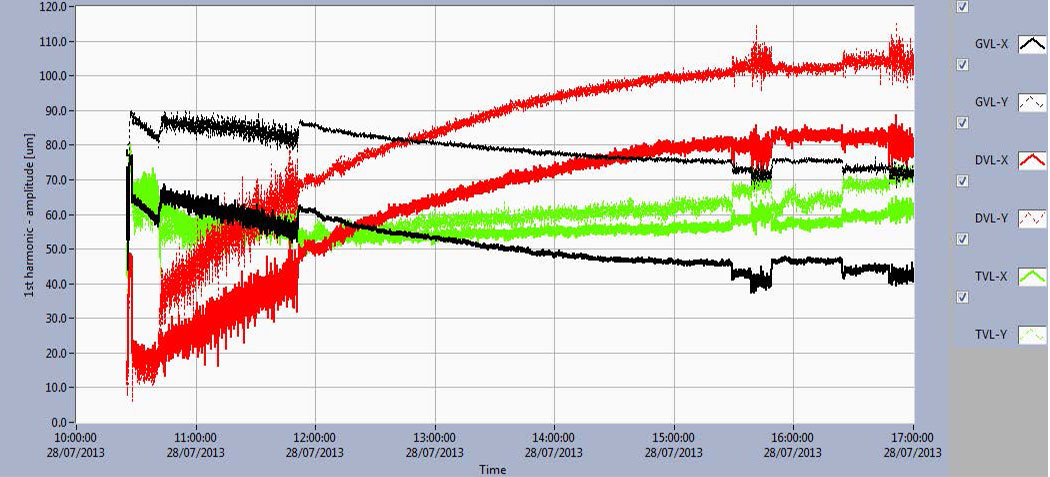
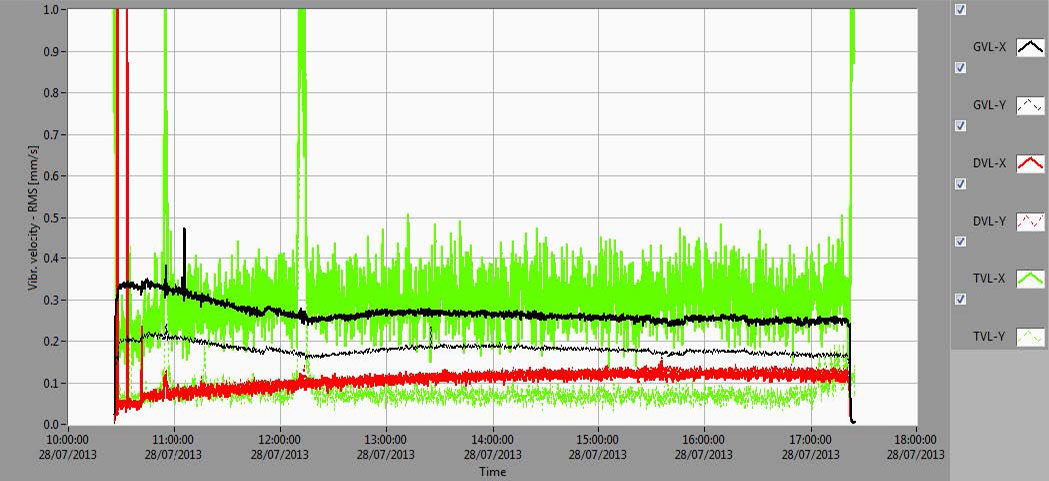
Fig. 11 Trend of first harmonic peak amplitude for shaft displacement (upper diagram). Trend of effective (RMS), that is, overall vibration velocity (lower diagram).
It’s seen that the vibrations in all regimes are under 100 μm, at ~50% of bearing clearance (and absolute vibration RMS levels are under ~0.4 mm/s). A relatively large rotor run-out at UGB position is a consequence of the fact that the rotor is deformed, which was present in the same form before the overhaul. But, since the connection between the thrust collar and shaft was not rigid it diminished this deformation at UGB zone. When the connection between thrust collar and shaft was corrected in the overhaul, the run-out manifasted itself fully.
Absolute bearing housing vibrations shows that after the overhaul, forces originating from the shaft and transferring to the stator and foundation were reduced multiple times when compared to the state before the overhaul.
This state was controlled with measurements in the next year and remained unchanged.
4. CONCLUSION
This article describes the use of relative and absolute vibration (radial) measurements with appropriate diagnostic techniques to adequately determine vibration root cause and overhaul procedures. It is important to cover all regimes to adequately diagnose the problem. By appropriate problem identification it is possible to define the neccessary overhaul procedures.
One measurement technique which included multiple measurement configuration by removing sensors from plane to plane through the unit’s vertical (axial) axis showed to be particularly useful. This particular technique enabled adequate rotor dynamical line establishment which gives a direct insight into how the forces are accumulated in the rotor.
Overhaul procedures were also briefly described. These procedures which lead to the problem solving were agreed by the measurements/diagnostics team, overhaul and power plant experts and included three groups of activities: thrust collar overhaul, verticality, horizontality and perpendicularity of the appropriate components (thrust block, shaft, runner etc) and dynamic rotor balancing.
By these overhaul measures – unit’s dynamical stability was ensured for a long term period. This was confirmed by periodical measurements during the next year after the overhaul. Vibrations were within the acceptable levels (relative – under 50% of bearing clearance and absolute under 0.5 mm/s RMS).
5. REFERENCES
[1] A. Muszyn´ska: Rotordynamics, Taylor & Francis, 2005
[2] C. M. Harris, A. G. Piersol: Harris shock and vibration handbook, McGraw Hill, 2002
[3] ISO 7919-1: 1996: Mechanical vibration of non-reciprocating machines – Measurements on rotating
shafts and evaluation criteria; Part 1: General guidelines 1996
[4] ISO 7919-5:2005, Mechanical vibration of non-reciprocating machines – Measurements on rotating
shafts and evaluation criteria – Part 5: Machines sets in hydraulic power generating and pumping
plants, ISO, 2005
[5] ISO 10816- 1:2000; Mechanical vibration Evaluation of machine vibration by measurements on
non-rotating parts; Part 1: General guidelines, 2000
[6] ISO 10816-5:2000, Mechanical vibration — Evaluation of machine vibration by measurements on
non-rotating parts – Part 5: Machine sets in hydraulic power generating and pumping plants, ISO,
2000
[7] J. P. Den Hartog, Mechanical Vibrations, McGraw Hill, 1956
[8] E. Zulovic, A novel approach in solving high intermittent vibrations following
modernisation and upgrade project, HydroVision 2015, Portland, OR, USA