
SUMMARY
A portable vibration device was used to perform measurements on a 333 rpm, 144 MW, Francis turbine hydro unit. The unit was recently refurbished and the main purpose of these measurements was to identify the root cause of large radial shaft displacements near the turbine guide bearing. It was identified that the vibration levels increased with load and at 120 MW were considered too high. This practically limited the maximum load that this unit could be operated in safely. The vibration levels at maximum load exceeded the bearing clearance which is unacceptable, even for a short period of time.
Using appropriate diagnostic techniques, it was shown that the cause for the unacceptable vibrational state was the hydraulic unbalance of the turbine rotor. The vibrations at the turbine bearing increased continuously with the flow rate because the turbine rotor was asymmetric. Water intake on the turbine produced radial forces on the blades that were not balanced out. The radial force rotated with the rotor causing a vibrational response at 1x rotating frequency which increased with load (flow rate). Additionally, magnetic unbalance of the generator was also present. This was identified with changes in the vibrational behaviour observed at the generator bearings when the excitation was on and the load increased to change the magnetic state in the generator air gap.
In addition, measurements were performed by slowly opening the wicket gate and increasing the rotational speed from nominal up to ~490 rpm. Shaft displacement at the upper and lower guide bearing indicated that there existed behaviour similar to a critical speed effect (high 1x amplitude and phase shift) at ~350 rpm which is very close to the nominal speed. Since the critical speed should be much higher, the only realistic explanation is that the rotor stiffness decreased, likely due to the interference changing between the rotor rim and spider.
INTRODUCTION
Shaft and bearing vibration measurements were performed on a newly refurbished unit (333 rpm, 144 MW, 160 MVA) in October 2014. The goal was to identify the root cause of large radial vibrations at the turbine guide bearing (TGB) plane.
Due to the large vibrations, the unit is unable to operate at full load because the amplitudes of the relative shaft vibrations exceeded the turbine bearing clearance which is absolutely unacceptable. For this reason a 120 MW maximum load limit was established. At 120 MW, vibration peak amplitudes reached ~170 μm. Due to these vibrations the oil film thickness between the shaft and bearing segments was reduced to such a value that threatened the dynamic stability of the unit.
Since the measurements were performed on all bearing planes including upper and lower guide bearings, it was possible to gain insight into the possible issues in those machine zones too. Magnetic unbalance was detected which changed the vibration response on the generator bearings. This unbalance was not so severe to create vibrational problems.
For comparison, the vibration response of another unit of the same design (inside the same power plant) was much lower. This was another indication that there was no design related issue but that this is an issue, particularly at the turbine guide bearing.
MEASUREMENT LAYOUT
Vibration measurements were performed using CoDIS PMU1, 16 channel portable vibration measurement instrument, and measurement and analysis software, CoDiS-PDS2. The displacement sensors (3.33 V/mm) and accelerometers (500 mV/g) were used along with a phase reference/once per turn signal, also used for RPM measurements. Four sensors (2 displacement sensors + 2 accelerometers) were used on each bearing plane. Two sensors of the same type were placed radially at a 90° angle from each other.
- Upper Guide Bearing (UGB): 2 relative vibration sensors were taken from the existing monitoring system due to the shaft inaccessibility in the UGB zone; 2 absolute vibration sensors were placed on the bearing housing
- Lower Guide Bearing (LGB): 2 relative vibration sensors were placed underneath the bearing housing; 2 absolute vibration sensors were placed on the bearing housing
- Turbine Guide Bearing (TGB): 2 relative vibration sensors; 2 absolute vibration sensors were placed on the bearing housing
Schematic overview of the measurement positions is shown in Figure 1.
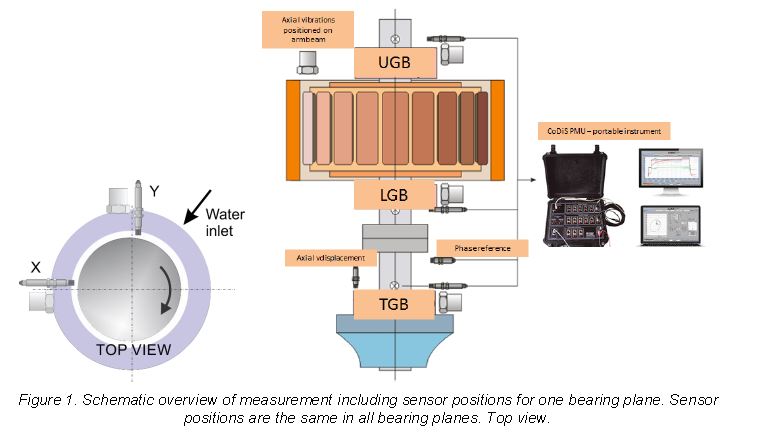
Only one bearing plane measurement positions are shown on Figure 1 (left), but the layout was the same for all measurement planes. During the measurements – the following operating regimes were covered:
- Run-up to nominal speed followed by automatic excitation (field flash)
- Excitation turned off and rotation on nominal rotational speed in mechanical rotation (free run) for about 10 minutes
- Excitation turned on and rotation without load for about 10 minutes
- Synchronization and load increase to 25 MW; rotation for about 10 minutes
- Load increase to 50 MW; rotation for about 10 minutes
- Load increase to 75 MW; rotation for about 10 minutes
- Load increase to 100 MW; rotation for about 10 minutes
- Load increase to 120 MW; rotation for about 10 minutes
- Load increase to 144 MW; rotation for about 10 minutes
- Load decrease to 120 MW; rotation for about 5.5 hours on constant load (120 MW)
- Load decrease and excitation turned off
- Overspeed to 485 rpm and free run-down (without braking)
For each sensor all relevant values were calculated (including effective values, order analysis, Non (1x + 2x + 3x) (Rest) value) which were trended for the duration of the experiment. Additionally, for each relevant operating regime, raw waveform signals were recorded thus enabling additional analyses.
RESULTS
OVERALL
The overall vibration parameters Smax (maximum shaft displacement per bearing plane) and Vrms (effective (RMS) vibrational velocity) are shown in Figure 2 along with rotational speed.
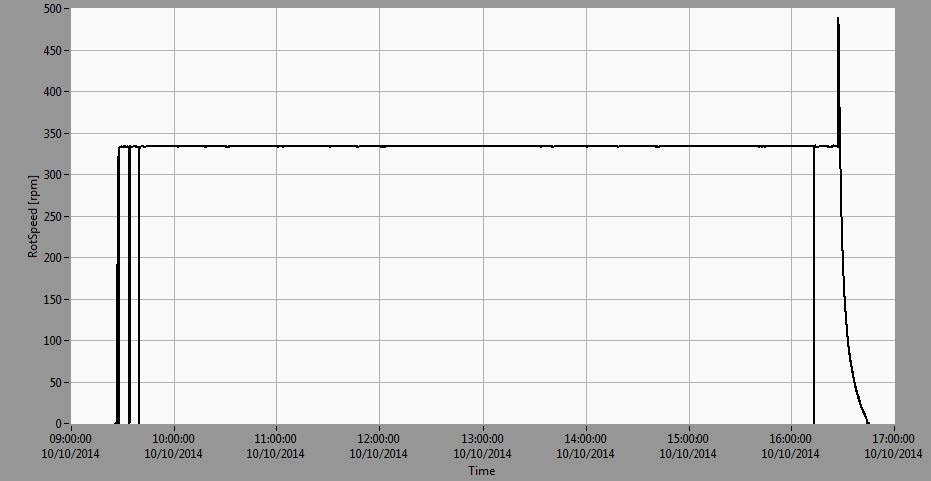
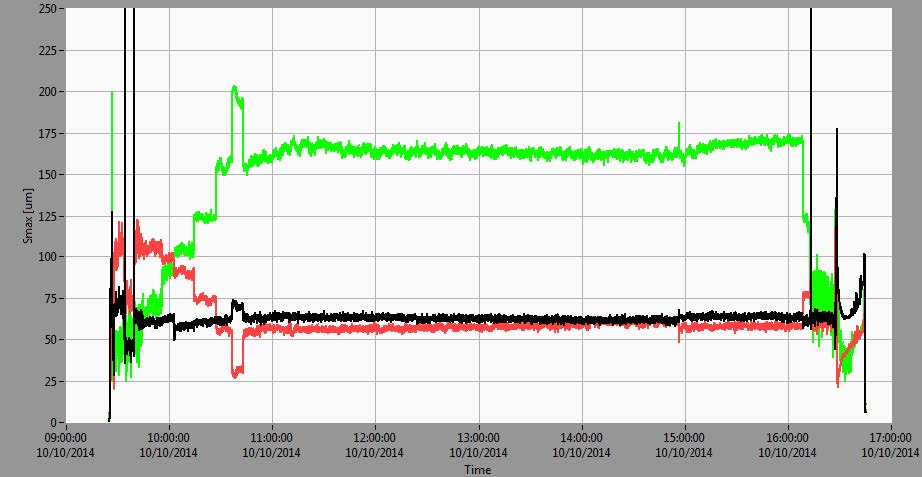
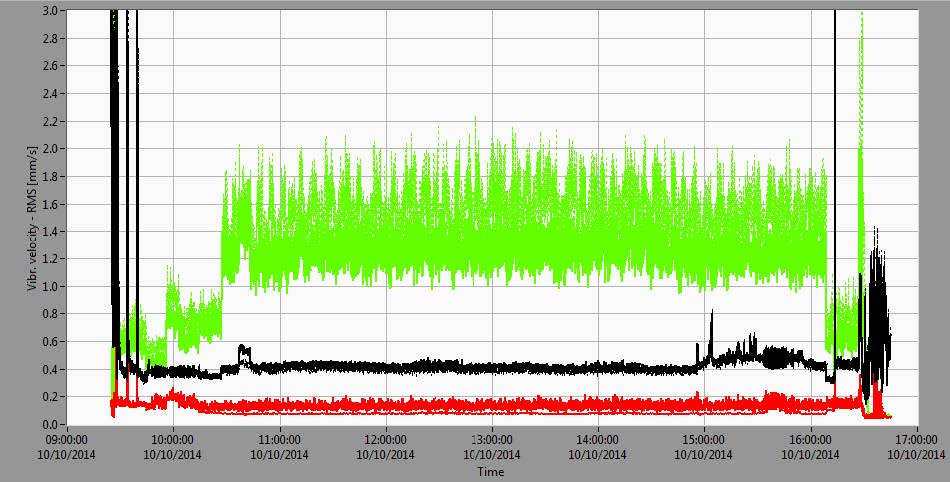
Figure 2. Trends of rotational speed (upper diagram), largest relative shaft displacement in a measurement plane Smax (medium diagram) and vibrational velocities (Vrms) of bearing housings (lower diagram) during experiment
The measurement lasted approximately 7.5 hours. During the first 1.5 hours the unit was run to nominal speed with automatic excitation. After that, the excitation was turned off and then on again (after ~5 minutes) following synchronization and load increase in ~20-25 MW steps: 25, 50, 75, 100, 120, 144 MW. The load was then decreased to 120 MW, due to the extreme vibrations and the unit was run at 120 MW for several hours. Near the end of the experiment (last 30 minutes) the load was decreased and the machine tripped due to overspeed reaching ~490 rpm. All of the braking systems were inactive and the machine coasted down freely.
From Figure 2 it can be seen that the overall vibration levels (Smax) at TGB and LGB depend significantly on load while not as significantly at UGB. At larger loads, above 100 MW, vibrations at TGB reached extremely large values above 200 μm, exceeding bearing clearance and producing large loads on the TGB segments. This state is absolutely unacceptable.
At the same time the vibrations decreased at the LGB from ~100 μm in nominal speed and in excited state (before synchronization) they decreased to 25 μm at 144 MW load. Bearing housing RMS vibrational velocities (Vrms) at the UGB and LGB in steady state operational modes were small (~0.5 mm/s at UGB and ~0.2 mm/s at LGB), but at the TGB the vibration velocity was continuously ~1.5mm/s which is considered moderate.
Figure 2 shows that there exists vibration-related problems with this unit by simply considering Smax and Vrms, but the actual root-cause cannot be determined without analysing data from the frequency domain including amplitude and phase (order). In the following text it will be shown that the most relevant vibration component is that at the rotational speed frequency – that is, the first harmonic.
HARMONIC (ORDER) ANALYSIS
Fourier transform is used to analyze the signals in the frequency domain. Besides all the relevant values being continuously calculated from the raw signals and trended (including Smax, Vrms, order harmonics – amplitudes and phases, signal DC) the raw signal data can also be recorded on demand or event.
Figure 3 shows amplitude and phase trends of the first harmonic (order) of the rotational speed for relative vibrations and amplitudes of the first harmonic for absolute vibrations.
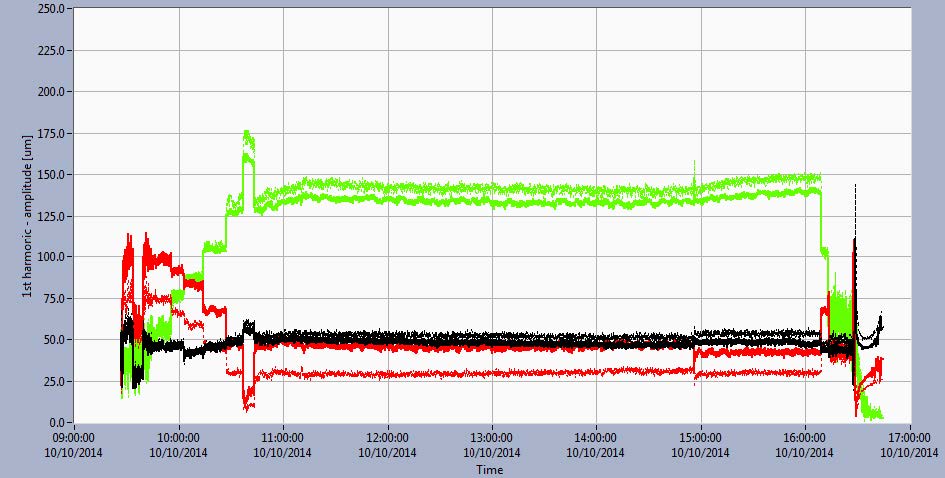
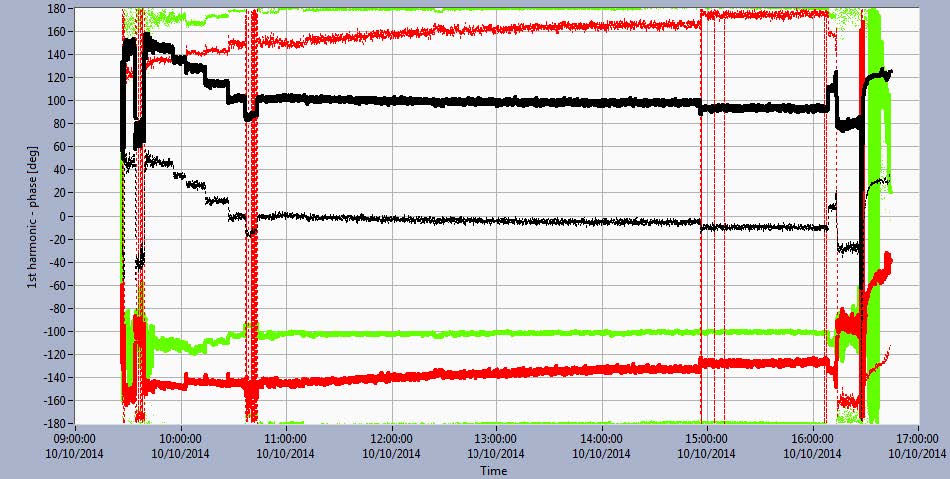
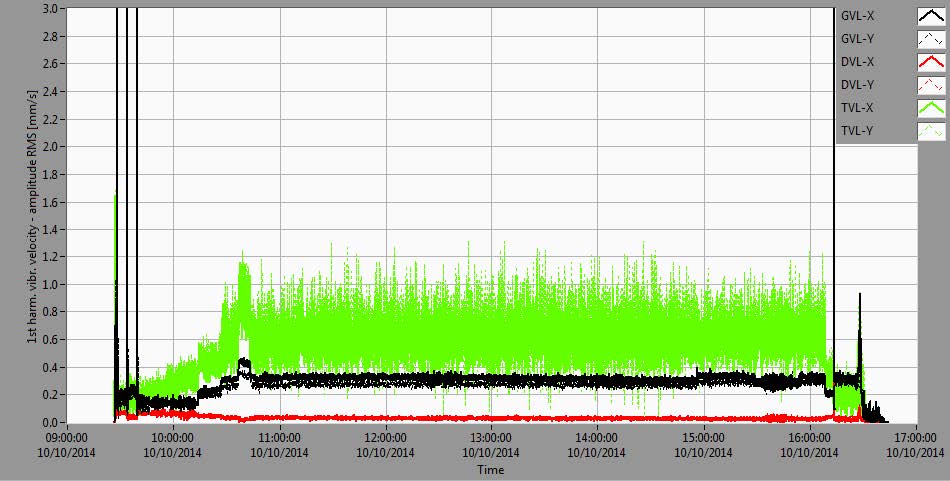
Figure 3 Trend diagrams of amplitude changes (upper diagram) and phases (middle diagram) of the first harmonic of relative vibrations on UGB, LGB and TGB. Amplitudes of vibrational velocity of bearing housing (lower diagram) in directions X and Y during the experiment.
RELATIVE SHAFT VIBRATIONS:
When comparing the Smax trend (Figure 2, middle diagram) to that of the amplitude peak of the first harmonic of relative vibration (Figure 3, upper diagram), it can be seen that there are great similarities between the two. The numbers are very similar (Smax3 is, by definition, always larger than the amplitude peak due to the way it’s calculated, but by how much depends on the type of vibrational problem involved,
that is the frequencies involved). This basically means that everything relevant for dynamic analysis can be seen from the first harmonic of rotational speed.
Looking at the upper diagram of Figure 3, it can be seen that peak (amplitude) increased from ~50 μm in mechanical rotation (nominal speed) to ~175 μm at 144 MW load. There was practically no influence on the TGB vibrations when the excitation was turned on. The TGB phases changed very little during the load increase. The maximum change from the mechanical rotation to maximum load was ~10-15°. Since the first harmonic vibration amplitude was changing and there were almost no changes in the vibration phases it can be concluded that the forces on the turbine rotor changed significantly during the load increase and that these forces changed in the same direction during the whole process.
On the LGB the vibrations changed significantly when the excitation was turned on. The vibration amplitudes decreased upon load increase. In mechanical rotation, the amplitudes were ~50 μm, on excitation ~100 μm and on maximum load they were very small values (below 25 μm). The phases changed sharply when the excitation was turned on (~70° when compared to the mechanical rotation) and changed very little during the load increase. The maximum change from rotation with excitation to maximum load was ~10-15° (~10° in the X, and ~15° in the Y direction). From the significant changes in peak amplitudes on load increase, it can be concluded that at the LGB the forces changed significantly with load, but that the direction of the force was practically the same in all working regimes.
On the UGB the situation was the opposite. Peak vibration amplitudes were practically unchanged during the experiment (around ~50 μm) but the phases changed significantly – from rotation with excitation (no load) to maximum load by ~70°. So, in order to draw an adequate conclusion about the machine behaviour, one should always check amplitudes and phases as this example shows that the invariance of amplitudes does not necessarily mean that the forces acting on the bearings do not change.
ABSOLUTE VIBRATIONS:
Vibration amplitudes of vibrational velocities of the bearing housing (Figure 3, lower diagram) were the largest at the TGB. Occasionally they exceeded 1 mm/s and, in general, increased with load.
At the LGB the absolute vibrations on the first harmonic were very small (0.1-0.2 mm/s) and followed relative vibration trends (decreased with load increase).
At the UGB the vibrations increased with load to ~0.5 mm/s max.
The low vibration values at the first harmonic (5.5 Hz) at the LGB and TGB are not necessarily a result of the small forces at the bearings but it is possible that the stiffness of the bearing foundation was high. This was especially true for the LGB and TGB as they are anchored to the concrete foundation which (currently) has a high stiffness and, thus, doesn’t allow the development of larger vibrations.
The UGB housing is on the upper bracket which is connected to the generator stator frame. The stiffness of this bond is, by its nature, smaller than that of the LGB and TGB. That is why the UGB housing vibrations are a couple of times larger than that of the LGB (even though, in some regimes, relative vibrations of the LGB are larger than the UGB relative vibrations – see Figure 3).
Since the relative shaft vibrations are a much better representative of the forces acting on the bearings, the amplitude-phase characteristics on the first harmonic was analyzed in more detail since the Rest (Non (1x + 2x + 3x)) values were small. The first harmonic of the rotational speed is the most relevant representative of the vibrations. Further spectral analyses were unnecessary point since everything of relevance was at the first harmonic.
Besides dynamical vibrational response, it was also important to analyze the static (DC) position of the shaft within the bearings. These values were calculated from the DC part of the relative displacement signals between two trigger impulses.
It was found on excitation (mainly on the UGB and LGB) and load increase that there were changes in the orbit static positions. On excitation, there was an increase of ~30 μm on the UGB and LGB directions, but insignificant change on the TGB. Additionally, upon load increase, the shaft changed static position in the UGB and LGB, but ~50 μm change was measured at the TGB.
Since the rotor and stator axes do not coincide when the excitation was turned on there was an unbalanced magnetic pull and the rotor was pulled in one direction which was eventually limited by the guide bearings. Additionally there were changes in the orbit shapes with excitation indicating electromagnetic unbalance. This can be seen in Figure 4 from the orbit diagrams A and B.
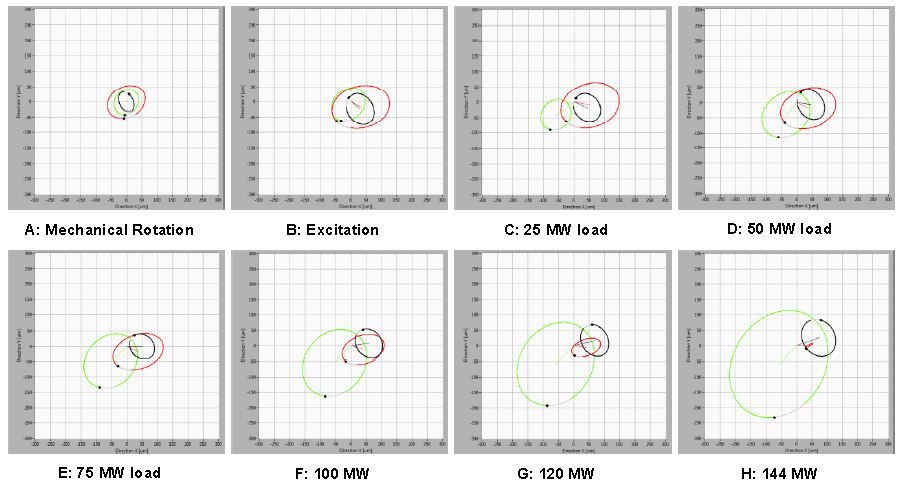
Figure 4 Orbits of relative vibrations (first harmonic) in all bearing planes (UGB – black, LGB – red, TGB – green) with static positions included in all relevant regimes. Direction X and Y are indicated on Figure 1.
Additionally, when the load was increased from ~25 MW to ~144 MW there were no significant changes in the statical positions (up to ~10-15 μm). But, at the same time there were significant changes in the dynamic vibrational response, especially at the LGB and TGB. These are due to the hydrodynamic and electromagnetic influences.
Since from mechanical rotation (a few m3/s flow) to maximum load (~60 m3/s flow) there were small changes in the turbine rotor shaft static position, it can be concluded that the water flow was not producing enough static force to push the shaft, that is the water intake was practically symmetric in the radial direction.
Since there were large changes in the vibrations (on the first harmonic) on load increase, it can be concluded that the rotor blades do not produce symmetrical reactive forces even though the water intake was completely symmetrical. There was a force that did not cancel out to zero and, due to rotation, rotated with the unit. If the rotor was completely symmetrical, this force would be zero. It produced turbine rotor vibrations and with the shaft rotation resulted in vibration at the first harmonic. Increasing flow increased this force and, consequently the vibration levels.
For the generator side, there were significant changes in vibrations when the excitation was turned on. This is a sign of electromagnetic unbalance which was a result of the magnetic attractive forces between the stator and the rotor not cancelling out to zero. So, there was a force rotating with the shaft which rotated with the rotor and resulted in first harmonic vibrations.
It could be argued that the electromagnetic forces on the generator could be causing the vibrations on the turbine bearing or the other way around, but further analysis will show that these two behaviours are, practically, independent.
We already saw (Figures 2, 3 and 4) that the vibrations changed simultaneously on both generator bearings (UGB and LGB) and turbine bearing (TGB) but that the vibrational response was very different on the generator and turbine bearings.
From the amplitude and phase changes on the first harmonic of the relative vibrations vectors can be drawn. This is shown on Figure 5.
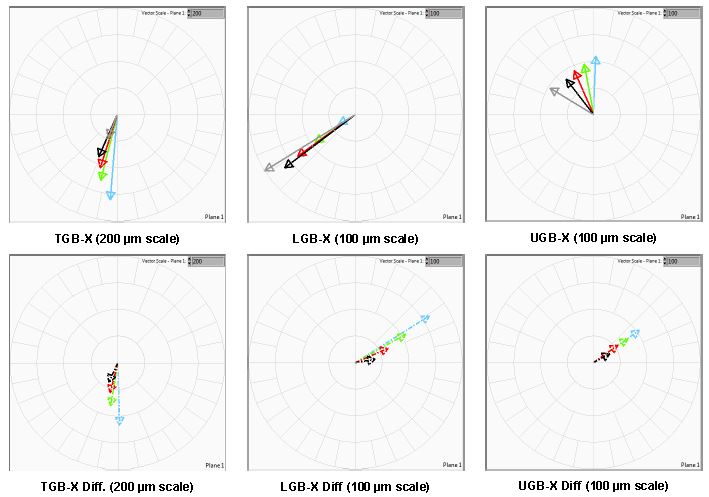
The values of amplitudes and phases are given (for both directions – X and Y) below:
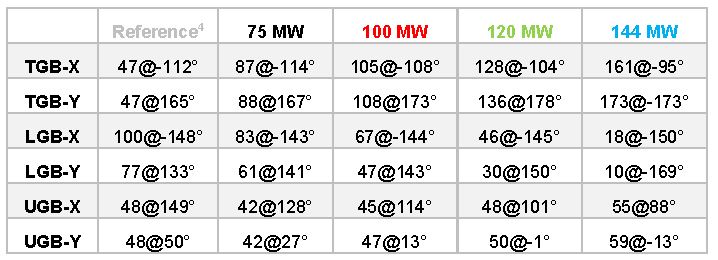
Table 1 Vibration vectors (amplitudes in μm and phases) for relative vibrations (first harmonic) from reference (nominal speed, excited) to 144 MW load.
From Figure 5 and Table 1 it can be seen that, during the load increase, the vectors were pointing in approximately the same direction for TGB-X and LGB-X. For UGB-X the vector was changing in phase, during load, but had similar amplitude. Similar vector characteristics were observed in the Y direction.
Instead of just vibration vectors, it is much better, for visualization purposes, to check how much the vectors are changing in such a way as to compare some vibration vector to a selected reference value. Nominal speed, excited value was chosen for a reference value and differences from this value were drawn in the lower row of Figure 5. This regime was chosen for a reference as to eliminate all vibrational influences beside electromagnetic unbalance on the generator and hydraulic unbalance on the turbine during load increase. Influence of mechanical unbalance was eliminated because it appears with the same value (since the rotational speed remains the same) in mechanical rotation. Influence of excitation, no load, is eliminated with this reference choice too.
It can be seen that, during load increase, the vibration vectors on TGB-X due to increased flow changed in almost the same direction (the vibration vectors were increasing). This is because the hydraulic unbalance increased with flow and acted at, approximately, the same position on the turbine rotor.
On the LGB-X and UGB-X it can be seen that during load the vectors were changing (the vibration vectors were decreasing) in the same direction too. The direction of change was the same direction for both positions. These changes were due to electromagnetic forces and, since, electromagnetic asymmetry is always located at the same rotor position, its influence on LGB-X and UGB-X was in the same direction.
After excitation was turned on and new forces appeared on the generator rotor this had no influence on the turbine bearing (for example, Figure 3 and Figure 5). The vibrational response was seen on LGB and UGB but not on TGB where there were no changes in vibrational response. At this point the flow through the turbine remained the same. So, the forces on the generator rotor had no influence on the turbine rotor.
But no influence exists from the turbine to the generator rotor on load increase. If hydraulic forces had the influence on the behaviour of the generator rotor, the vibration increase would be seen in the same direction related to the direction of forces on the turbine rotor. But this is not the case as seen from Figure 5.
So, for vibrational behaviour in the generator zone – electromagnetic forces in the generator zone are relevant and, for vibrational behaviour in the turbine zone – hydraulic forces in the turbine zone are relevant.
Although electromagnetic unbalance exists, the vibrations on the generator bearings had good values which were achieved by adequate rotor balancing procedures. Additionally, the vibrations in mechanical rotation were very small (~50 μm) which is favourable for overspeed (where vibrations always increase) as the vibrations will not exceed dangerous levels. So, the generator rotor was optimized by adequate balancing and could operate in all regimes with no problems.
Unfortunately, this was not true for the turbine rotor. Due to the increasing vibrations with load, the load limit was set to 120 MW since there is a high risk of bearing damage (bearing segments and seals etc). The turbine rotor is asymmetrical possibly due to:
- Blade manufacturing faults (geometry) – that is, blade curvature for one (or more) blades
- Position faults (welding) for one (or more) blades
This problem will not be resolved unless the turbine rotor is repaired or replaced.
OVERSPEED TEST
The turbine regulator allows the overspeed test to be conducted by regulating the guide vane opening and releasing more water on to the turbine. As already explained, the final operating regime was overspeed and free run down without breaking. This test allows enough time from overspeed to run down for all dynamic properties of the machine to be recorded. Maximum speed reached in the overspeed test was 485 rpm. Since the unit was very well balanced, there were no negative consequences for the machine even when passing through resonant states (through which the unit actually passes in overspeed).
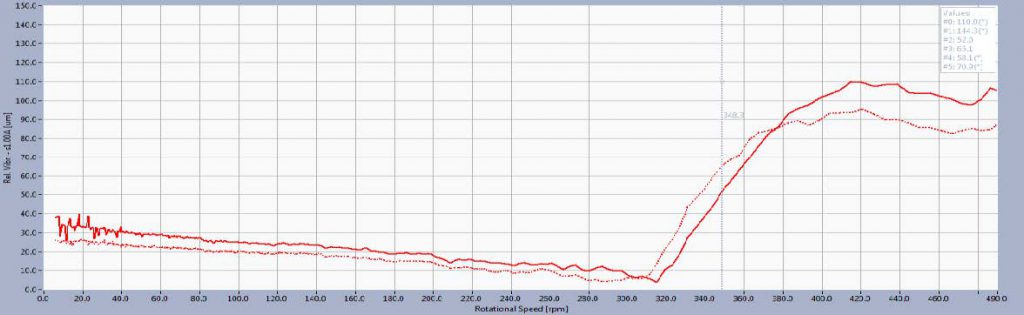
Figures 6 and 7 shows the amplitude and phase of 1x vibrations during overspeed and run down. Dynamic instability was present between 350 and 420 RPM which caused significant and rapid changes in both amplitudes and phases. This phenomenon was not visible on machine start up when the process of speeding up was very fast and vibration amplitudes don’t have time to evolve.
In free run down (no breaks) it is visible that vibrations amplitudes were the highest at 420 rpm on the LGB. At 310 rpm the amplitudes were very small as a result of vector cancellation between the unbalance vector and the run out vector.
Run out was also present to some extent and was visible at lower rpm, where no dynamic forces were present.
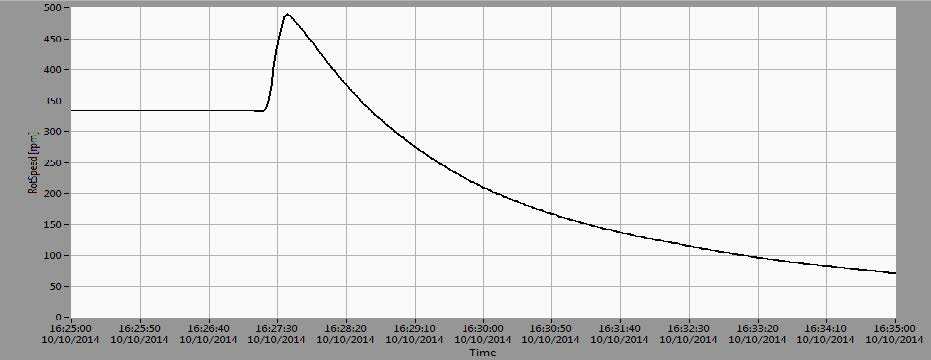
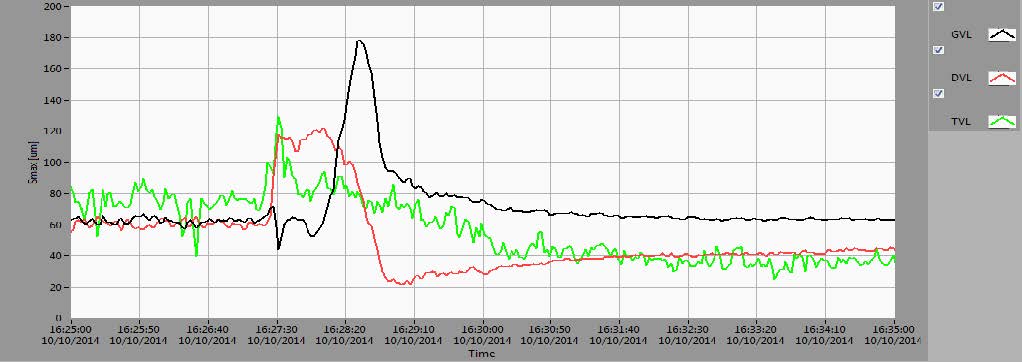
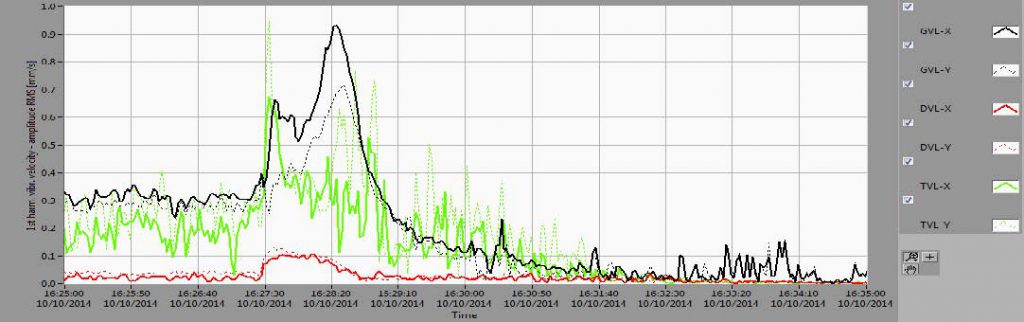
Figure 6. Rotating speed (upper diagram); Smax on UGB (black), LGB (red) and TGB (green) vs time (middle diagram); S1n amplitudes for X and Y sensors on UGB(black), LGB (red) and TGB (green) vs time (lower diagram)
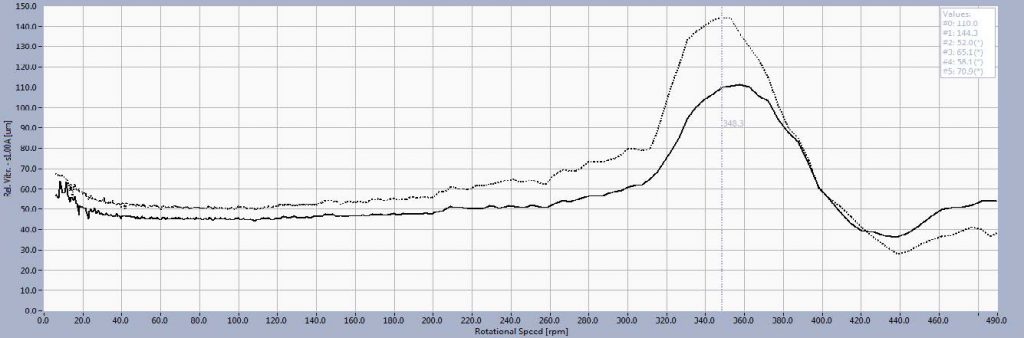
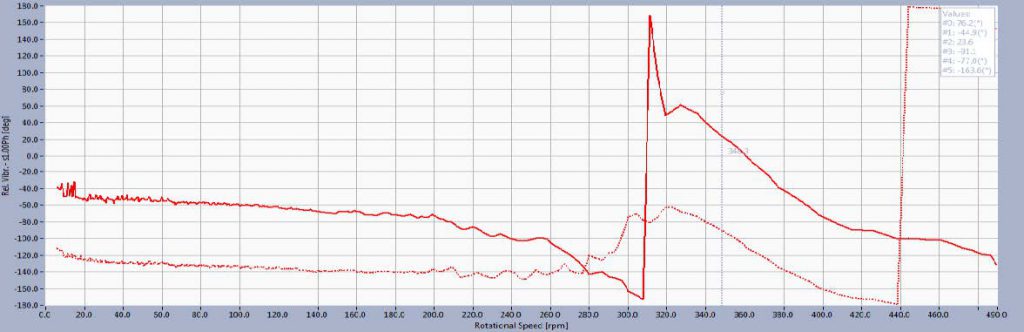
At the UGB vibration amplitudes reached their maximum (S1n=145 μm) at 350 rpm. They decreased afterwards with the machine slowing down reaching mechanical run out values (50-60 μm).
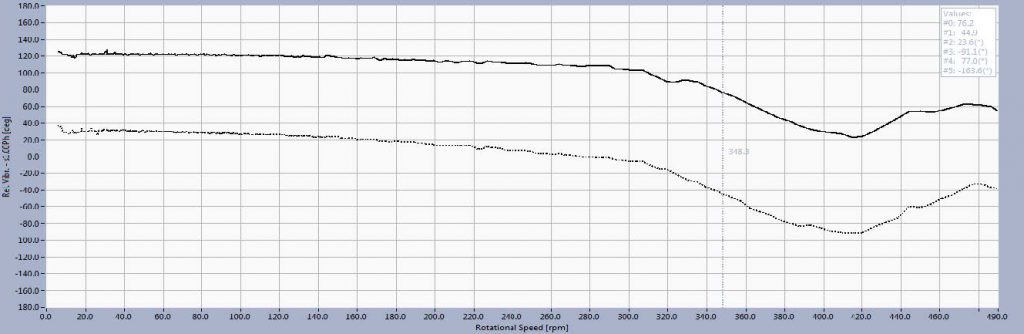
In the same process the phases change was 180º which is characteristic behaviour for passing through the resonance.
Resonant effect, which is described and recorded, doesn’t show signs of typical response when passing through the 1st critical speed. Normally, it would be expected that the amplitudes and phases on the UGB and LGB change in the same manner (both raise near critical speed and then decrease away from it).
Instability shown on Figure 7 is typical for floating rim design where rotor stiffness changes in run up between 360-420 RPM. When the rim is floating its stiffness is no longer affecting the overall rotor stiffness and therefore the dynamic response changes. Different response on UGB and LGB are explained as continuous change of vibration form and resonant frequency in that speed range.
CONCLUSION
Hydraulic unbalance was detected on a 333 rpm, 144 MW, Francis hydro unit after refurbishment. The vibrations at the turbine bearing increased with flow and at maximum load exceeded 200 μm which is beyond the bearing clearance. Due to the vibration levels, the unit is currently limited to 120 MW maximum load. The cause of the hydraulic unbalance is likely due to an asymmetrical turbine rotor which requires removing the turbine for repair or replacement.
Measurements in overspeed show a resonant effect of the rotor near nominal speed. The generator vibration instability is between 350 to 420 rpm. The resonant effect is a result of the centrifugal forces on the floating rim occurring at rotating speeds above nominal.
REFERENCES
[1] C. M. Harris, A. G. Piersol: Harris shock and vibration handbook, McGraw Hill, 2002
[2] ISO 7919-1: 1996: Mechanical vibration of non-reciprocating machines –Measurements on rotating shafts and evaluation criteria; Part 1: General guidelines 1996
[3] ISO 7919-5:2005, Mechanical vibration of non-reciprocating machines – Measurements on rotating shafts and evaluation criteria – Part 5: Machines sets in hydraulic power generating and pumping plants, ISO, 2005
[4] ISO 10816- 1:2000; Mechanical vibration Evaluation of machine vibration by measurements on non-rotating parts; Part 1: General guidelines, 2000
[5] ISO 10816-5:2000, Mechanical vibration — Evaluation of machine vibration by measurements on non-rotating parts – Part 5: Machine sets in hydraulic power generating and pumping plants, ISO, 2000
[6] J. P. Den Hartog, Mechanical Vibrations, McGraw Hill, 1956