
ABSTRACT
It has long been known that comparing the partial discharge results obtained from a single machine is a valuable tool enabling companies to observe the gradual deterioration of a machine stator winding and thus plan appropriate maintenance for the machine [1]. In 1998, at the annual Iris Rotating Machines Conference (IRMC), a paper was presented that compared thousands of partial discharge (PD) test results to establish the criteria for comparing results from different machines and the expected PD levels [2]. At subsequent annual Iris conferences, using similar analytical procedures, papers were presented that supported and expanded upon the previous criteria [6 – 21].
In the past few decades, trending of PD results has provided plant maintenance personnel with advanced notice as problems develop within their stator winding insulation. Though prediction of failure is never exact, increases in PD activity over time have been shown to indicate advancing damage to the stator winding that could lead to premature failure. There are many type of instruments and configurations used to test PD. This paper discusses the most commonly used configurations and how they impact the measurement of PD in stator windings.
Disclaimer: The analyses contained within make the assumption that the operating gas pressures are correctly entered into the database at the time of the test.
Calibration of on-line PD test results is impractical [3]; therefore, only results obtained using the same method of data collection and noise separation techniques are compared. For this paper, all the data were obtained with a PDA-IV, TGA, Trac or Guard test instrument. Data collected through 2015 was used; and, as in past papers, it is standardized for frequency bandwidth and pruned to include only the most recent full-load-hot (FLH) results collected for each sensor on operating machines. All questionable data or data from off-line testing or unusual machine conditions was excluded, leaving over 20,000 statistically independent new results collected from about 6,000 machines. The Appendix presents the statistical summary of the latest data to enable Trac, Guard, TGA, and PDA-IV test users to compare on a gross level their test results to those of similar machines.
There are many different types of PD testing equipment that have been used for coils and stator windings. The instrumentation to measure the PD current pulses most commonly includes an analog to digital converter that determines the number, magnitude and phase position (with respect to the 50/60 Hz ac cycle) of the PD pulses. Almost every brand of PD detector works in a different part of the frequency spectrum. Considering that each PD pulse is the result of a brief flow of electrons lasting only a few nanoseconds, frequencies from 0 Hz up to several hundred MHz are created by each discharge. Thus PD can be detected in a very wide range of frequencies, and this will affect what is actually measured. This paper discusses how the frequency range affects the detection of PD in stator windings and compares results from different assets tested using the same configuration.
1 INTRODUCTION
Partial discharges (PD) may occur in electrical insulation systems that operate at 3.3 kV and above. PD only occurs when a gas filled voids are present within the insulation or a gas (usually air) is present on the insulation surface when there is a high electric stress [23]. If the stress is high enough, the gas will experience electrical breakdown, creating a spark consisting of energetic electrons which will break molecular bonds in any organic polymer. Thus PD will age the insulation and may eventually cause failure. PD occurs in a wide variety of high voltage electrical apparatus such as transformers, gas insulated switchgear, power cables and rotating machines. Since each discharge causes of a flow of charge, the PD can be detected by measuring the current pulses on the terminals of high voltage equipment. Off-line PD testing has been as a factory test for almost 100 years on equipment such as power cables. The purpose is to detect flaws created during manufacturing that lead to PD, and thus lead to insulation failure. In the past 30 years or so, owners of high voltage equipment are also measuring PD over time on installed equipment. Many aging processes can create voids that can lead to PD, and thus PD is often a symptom of thermal and thermo-mechanical aging processes. By monitoring the evolution of PD over time either in off-line tests or by on-line monitoring while the equipment is operating normally, equipment owners have a powerful tool for determining when maintenance or equipment replacement is needed. More commonly, machine owners have been using off-line and on-line PD testing to assess the condition of the stator winding insulation in order to determine if maintenance is needed. Problems such as loose coils in the stator slots, contamination leading to electrical tracking and thermal aging of the insulation are easily detected [24][25][26].
There are many different types of PD testing equipment that have been used for coils and stator windings. Most use a capacitor to detect the PD pulse currents in the presence of the 50/60 Hz high voltage. The instrumentation to measure the PD current pulses most commonly includes an analog to digital converter that determines the number, magnitude and phase position (with respect to the 50/60 Hz ac cycle) of the PD. However almost every brand of PD detector works in a different part of the frequency spectrum. Since each partial discharge pulse is the result of a brief flow of electrons lasting only a few nanoseconds, by the Fourier transform, frequencies from 0 Hz up to several hundred MHz are created by each discharge. Thus PD can be detected in a very wide range of frequencies, and this will impact what is actually measured. This paper discusses how the frequency range affects the detection of PD in stator windings.
2 PD – A COMPARISON TEST
Partial discharges (PD) are small electrical sparks that occur when voids exist within or on the surface of high voltage insulation of stator windings in motors and generators. These PD pulses can occur because of the manufacturing/installation processes, thermal deterioration, winding contamination or stator bar movement during operation. As the insulation degrades, the number and magnitude of PD pulses will increase. Although the magnitude of the PD pulses cannot be directly related to the remaining life of the winding, the doubling of PD pulse magnitudes approximately every 12 months has been used as a “rule of thumb” to indicate rapid deterioration is occurring [25]. If the rate of PD pulse activity increases rapidly, or the PD levels are high compared to other similar machines, this is an indicator that visual inspections and/or other testing methods are needed to confirm the insulation condition [4]. Furthermore, if the PD magnitudes by the same test method from several identical windings are compared, the windings exhibiting higher PD activity are generally closer to failure [1]. This paper examines the validity of this approximation.
PREVIOUS PAPERS
The conclusion of previous papers was that when comparing PD data results from different machines, the following parameters must remain constant:
- Test instrument bandwidth and noise separation techniques [2]
- Test instrument bandwidth and noise separation techniques [2]
- Type of sensors [2, 5, 12, 15]• Operating voltage of the machines [2, 11, 12, 19]
- Operating gas coolant of the machines – PD is pressure dependent [2, 8, 12, 21]
- PD levels appear to be influenced by the quality of design, manufacturing, and installation, and not solely operating hours or operating condition [6, 7, 10, 13, 14, 16, 20]
- Impact of ambient conditions [18]
Not as significant are:
- Type of insulation system [6, 9, 12]
- Type of insulation system [6, 9, 12]
- Machine type [2,5,6,11]
- Winding type [2,5,6,11]
Differences in operating loads and temperatures could also affect the results, but these were dependent on the condition of the stator winding and therefore, would only be applicable when comparing the PD results obtained from a single machine, not when comparing results from different machines.
3 STANDARDS FOR PD DETECTION
The most common standard referred to for PD measurement is IEC 60270 [23]. This document describes the test circuits for measuring PD, and describes the process for calibrating the detected mV magnitude of the PD pulse into apparent pico Coulombs (pC). Pico Coulombs, a unit of charge, is traditionally used for PD measurement since the damage to organic insulation by the discharge will be related to the number of electrons in the discharge, i.e. the charge. Since the groundwall insulation in high voltage stator windings is partly inorganic mica, this assumption may not be valid [27]. IEC 60270 normally assumes that a capacitor detects the PD, and that the test object is also predominantly capacitive (which is not true for stator windings). IEC 60270 [23] also suggests the measurement frequency be anywhere in the range from 50 kHz to 1 MHz. Any frequency can be used in that range, although it does categorize two sub-classes of detector:
- narrow band detection in the 9-30 kHz range with a center frequency anywhere between 50 kHz and 1 MHz
- wide band detection in the 100 kHz to 900 kHz range.
PD detection above 1 MHz is not covered by this standard.
In 2016, IEC 62478 was published [28]. It is a complementary document to IEC 60270, and it covers the frequency range above the 60270 document. In particular it defines the following ranges:
- Low frequency, LF -below 3 MHz (i.e. approximately the frequency range in IEC 60270)
- High frequency, HF – 3 to 30 MHz
- Very high frequency, VHF – 30 to 300 MHz
- Ultra high frequency, UHF – 300 to 3000 MHz.
In addition to detection of the PD by capacitors, this new document indicates the PD can be measured by high frequency current transformers (HFCTs) and different types of UHF antennae. Clause 4.3.6 of the standard makes clear that above the LF range, a direct calibration into pC is not feasible as has been pointed out in the past [27][29]. Instead a “sensitivity check” is performed by comparing a conventional LF PD test (measured in pC) with a test in the HF, VHF or UHF range (measured in mV or dbm). The document identifies several practical schemes for measuring PD above the LF range on switchgear, transformers and stator windings.
For the specific case of rotating machines, IEEE and IEC have developed documents to standardize the methods for off- and on-line PD testing. IEEE 1434 [3] provides guidance on the most widely used detection techniques and their application as well as information on PD theory and interpretation of PD data obtained from off- and on-line testing. IEC has published two standards in this area; IEC 60034-27 [24] covering off-line test methods
and IEC 60034-27-2 [25] regarding on-line PD testing.
- Compliance with IEC 60270 [23] for stator windings is unnecessary. IEC 60270 is only valid for capacitive test objects. A stator winding is not a capacitance. It is a complex inductive – capacitive circuit. Instead, IEC 60034-27-2 [25] is appropriate since it is concerned only with on-line PD measurement on machines.
- Compliance with IEC 60270 [23] for stator windings is unnecessary. IEC 60270 is only valid for capacitive test objects. A stator winding is not a capacitance. It is a complex inductive – capacitive circuit. Instead, IEC 60034-27-2 [25] is appropriate since it is concerned only with on-line PD measurement on machines.• IEC 60034-27-2 [25] makes clear that if one measures PD in the low frequency range, then electrical interference will be severe and one should expect a much greater risk of false indications.
4 CALBRATION
In maintenance planning, users want a level of PD above which maintenance is required, but below which the machine can continue to operate safely. It is not likely that these desires can be fulfilled easily, at least for testing on complete windings. This is because complete windings are not lumped capacitive elements, but are complex transmission tines with significant inductive components. Both ASTM D1868 [3] (in North America) and IEC 60270 (internationally) [23] caution against the calibration of PD quantities into pC in inductive apparatus. Furthermore, the transmission line aspects of windings yields attenuation and distortion effects which, are highly dependent on frequency. The result is that the PD test on complete windings is at best comparative, and is definitely not absolute.
The purpose of the calibration for testing of capacitive objects according to the standard IEC 60270 is to convert the physical measurement in mV or mA, to an apparent charge in pC so that the result is independent of the capacitance of the test object. The test results can be trended and compared only if the same instrument and the same pulse generator with same settings (such as pulse width, and rise time) are used. Contrary to the intentions of the standard, test results duly calibrated according to the IEC 60270 to show apparent charge in pC of the same object by different testing providers differ so high, that the test results cannot be compared. This is the reason why there is no known public database of test results from providers of instruments originally intended for capacitive objects.
This calibration difficulty is complicated by the fact that the calibration process is done at the winding terminals, yet the actual PD pulses are occurring within the winding, A PD pulse originating two coils into the winding from the line end, excites local resonant frequencies, and the pulse current (or voltage) has- to propagate to the winding terminals to be detected. During the propagation process through the winding, the pulses are attenuated and modified in frequency content by the intervening LC ladder network (or transmission line). Thus a calibration process at the stator terminals does not represent the load that the actual PD pulse sees within the winding.
Thus, there are two basic problems with using the PD magnitude (whether in pC, mV, mA, etc.) as an indicator of the severity of insulation defects in HV stator windings. The first problem is that PD is often not a cause of failure, but a symptom. The second is caused by the fact mentioned above: complete stator windings are not ‘lumped’ capacitors. [33]
Since the PD is not the direct cause of deterioration (although it certainly can have a second order effect), the time to failure is not related to the PD itself causing the insulation deterioration. Thus an increase in PD over time indicates that more deterioration has occurred. However, the actual magnitude of the PD is unrelated to how long it will take the insulation to fail, since the PD is not main agent causing the deterioration.
Calibration is not feasible – units are arbitrary, it is a comparison test.
5 VOLTAGE
It is well known that voltage has a dramatic effect on the PD magnitude, at least if the insulation is not excessively overstressed. Figure 1 shows the effect of voltage on the PD magnitude of a 13.8 kV epoxy-mica insulated stator coil, a 5% reduction in voltage around 8 kV causes 30% reduction in the PD magnitude, a 10% reduction, 60%. Thus, a small decrease in applied voltage causes an even larger decrease in the detected PD pulse magnitude. In addition, at a given test voltage, the number of pulses per second drops exponentially with pulse magnitude. Hence, there is a significantly lower PD pulse count rate at the lower voltages.
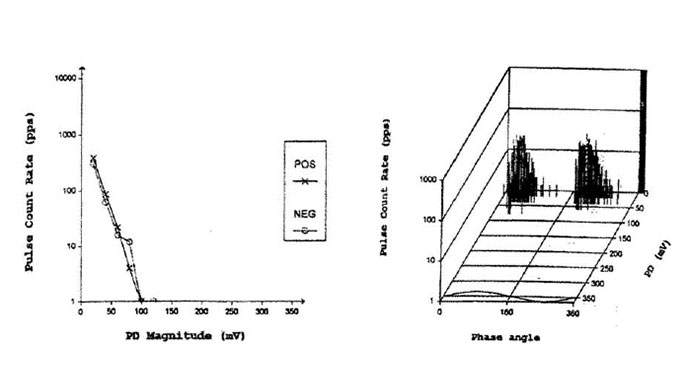
This has a significant implication for on-line PD testing, where the voltage across each coil decreases linearly between the phase terminal and neutral. In a typical machine with 100 coils, the coil connected to the phase end will have the highest PD activity (magnitude and number), A coil connected one coil down, will have a PD magnitude that is about half of that in the phase end coil, with the same amount of deterioration. A coil two coils down from the phase end, will have a PD magnitude one quarter of the magnitude in the phase end coil, and even fewer pulses. This analysis plus many years of visual observation of PD effects in actual machines show that only the first few coils in a winding suffer the most from PD. There is no PD at the neutral end.
From the data described above, it is clear that the coil voltage has a much higher impact on the PD magnitude than the winding attenuation effect. The result is that one can choose whatever bandwidth one desires for PD measurements in operating stators; if the PD sensor is located at the phase terminals, it is near the only coils likely to be subject to high PD activity Therefore, one can detect the PD at either low frequency or high frequency, since pulse attenuation at higher frequencies is relatively small, because the most active PD sites are close to the PD sensor.
Therefore, PD sensors should be located near the first few coils in a stator winding.
6 BANDWIDTH
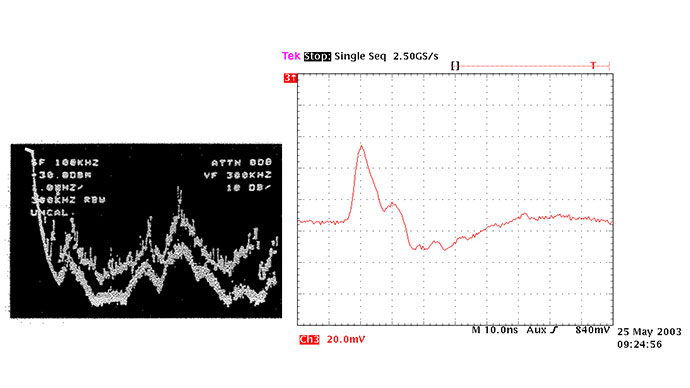
The frequency domain characteristics of a pulse stream can be calculated using standard Fourier transforms [39]. Alternatively, several papers [40][41][42] show how to calculate the spectrum, including the all-important upper frequency at which the signal level starts decaying to 0. From these calculative methods, it is clear that pulses, such as those shown in Figure 2 produce frequencies into ~300 MHz. To a first approximation, this can be seen by making, the unipolar pulse shown in Figure 2 into the first half cycle of a sinusoid. The unipolar pulse in Figure 2 has a duration of ~3ns. In constructing the sinusoid, there is a period of ~6 ns. Since frequency is the inverse of the period, the pulse in Figure 2 has harmonics at 160 MHz. For shorter duration pulses, frequencies to 350 MHz are present.
6.1 LF VS VHF OFF-LINE PD ON MOTOR STATOR
Off-line PD tests were performed using LF and VHF PD detectors on a 13.2 kV, 6000 HP motor stator winding [37]. The LF test was performed with a PDTech DeltaMaxx analyzer using a 1000 pF PD detection capacitor. It operated in the wideband mode in frequency range 40 – 800 kHz. C phase had the highest activity and is shown in Figure 3. Figure 3 (left) shows the phase resolved PD (PRPD) pattern obtained after stabilization at 8 kV (just above rated line to ground voltage). Figure 3 (right) shows the VHF PRPD plot measured on the same phase of the stator winding at the same voltage using an 80 pF PD sensor and an Iris Power TGA-B instrument. The PD detection frequency range is 40 -350 MHz.
The peak PD magnitude (Qm) for the VHF measurement (calculated using the definition for digital instruments in IEC 60034-27 [24] is +816 mV and -912 mV. The Qm is the magnitude at a PD pulse repetition rate of 10 pulses per second (pps). The LF PD instrument calculated Qm to be 2.5 nC, using the same 10 pps definition. Note however some LF instruments calculate the peak PD magnitude using a method based on an analog definition of the largest repetitive magnitude in a train of pulses, as defined in IEC 60270 [23].
C phase of this stator winding has a ratio of 2.7 pC/mV between the LF and the VHF detectors. However note the cautions in IEC 60034-27 [24] that different brands of PD instruments are likely to give much different pC levels even under the same test conditions. The PRPD patterns and the relationship between positive and negative PD is essentially the same between LF and VHF.
PD occurs into frequencies up to ~300 MHz
6.2 LF VS. VHF OFF-LINE PD IN A TURBINE GENERATOR STATOR
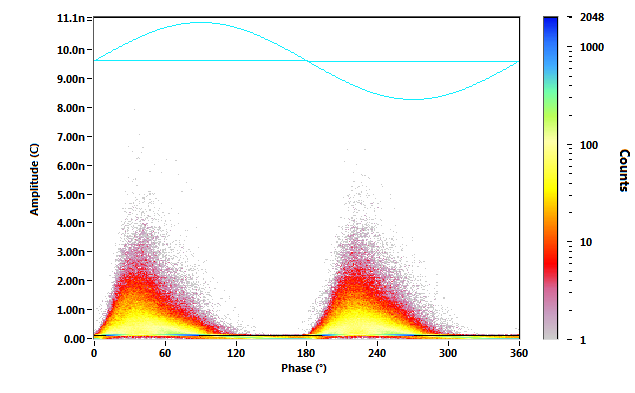
The stator winding of an 18 kV, 200 MVA hydrogen-cooled generator was also given an off-line PD test using both LF and HF instruments described above. The tests were done at about 9.7 kV, a little below the rated line to ground voltage, in atmospheric pressure air. Fig 2a shows the PRPD plot from Phase C, which had the highest activity. The plot shows classic internal groundwall activity (see IEC 60034-27 for PRPD plots associated with each type of PD source), with approximately equal positive and negative PD activity. A Qm of 1.1 nC was measured.
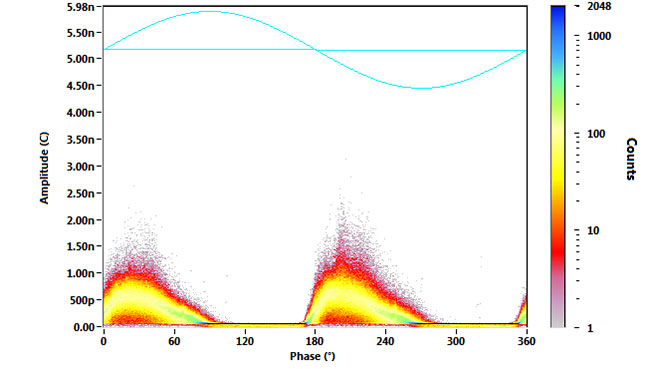
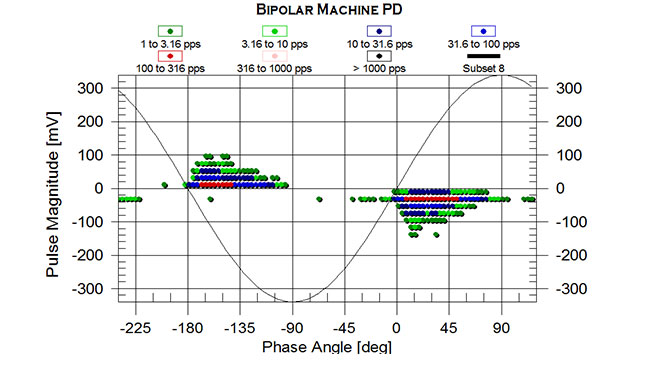
Figure 4 shows the PDPD plot measured in the VHF range on C phase under the same test conditions as for the LF test.
It shows the same PRPD pattern as for the LF test. The Qm (calculated at 10 pps) is +106 mV and -121 mV. Thus the ratio between the LF test in pC and the VHF test in mV is 9.1 pC/mV, which is substantially different than the ratio measured on the motor. This variability exemplifies the difficulty in calibration as described below.
6.3 SIGNAL TO NOISE RATIO
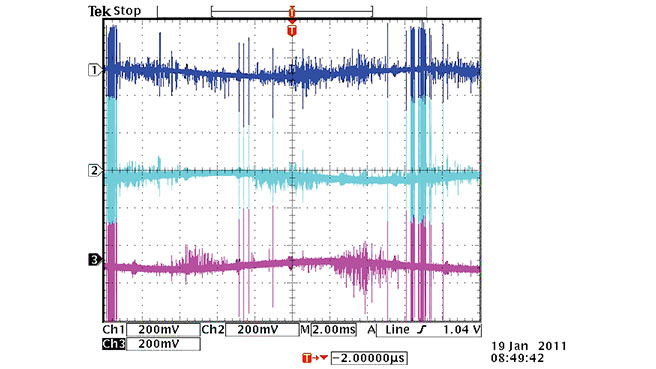
During on-line testing, the noise (i.e. electromagnetic pulses from sources different to PD from stator winding) becomes relevant, because the stator winding subjected to testing is connected to the rest of the system with many sources of noise (sparks from busbars, corona from bolts, tracking from insulators, PD from current transformers, sparks from tools, radio broadcasting signals, etc). This electrical interference is a factor which can have an influence on the measurement bandwidth. The electrical noise can be as much as l000x (60 dB) larger than the PD signals from an operating motor or generator, especially if the stator winding is cooled by high pressure hydrogen gas. [Figure 5]
The question to be asked when trying to detect PD in an operating motor-or generator is not-how large is the PD signal, but how large is the PD signal in comparison to the ‘noise’, i.e. the signal-to-noise ratio (SNR). Boggs [34] shows that if the noise has a broadband (white noise) characteristic, contamination theory indicates that the optimum (i.e. highest SNR) frequency band for PD detection, assuming there is little attenuation, occurs at ~250 MHz. This is because the power in broadband (white or electronic) noise increases with the square root of the bandwidth of the measuring system; whereas, the power in the PD signal increases proportionately, with bandwidth, up to the upper limit set by the PD pulse risetime. The result is that the SNR increases with the square root of the bandwidth. A higher SNR reduces the risk of false indications of stator winding problems caused by noise. This is why VHF or UHF with UWB (i.e. ~100 MHz) PD detectors have become dominant for on-line PD defection in rotating machines [33], [35], [36].
On-line tests, high SNR (VHF or UHF with UWB) reduces risk of false indications
6.4 ADVANTAGES OF LF AND VHF PD DETECTION
Off-tine PD testing is best performed with PD detectors operating in the 1 MHz range, to ensure that PD can be detected in all the coils in a stator winding with the minimal amount of attenuation. On-line PD tests are best performed at higher frequencies since this optimizes the signal to noise ratio, as well as enabling the separation of disturbances from PD based on time-of pulse arrivals. The result is a PD signal free of interference, and thus a reduced risk of false alarms. Although more pulse attenuation will occur at the higher measurement bandwidth needed to separate out the noise, this attenuation is relatively minor, since in an operating stator the sensor can be placed very close to the few coils experiencing the HV.
Off-line tests on both coils/bars and complete stator windings should be performed in the LF range, even though Figure 3 and Figure 4 show the PRPD patterns are essentially the same. For coil/bar tests this will allow the PD to be scientifically quantified in terms of apparent charge (pC). For windings, the LF range maximizes sensitivity to PD in more of the coils/bars in the winding.
The basic advantages of the LF test for off-line testing, as described in IEC standards [24][28], include
- The LF advantage of greater sensitivity is less important than for off-line tests, since the coil/bar voltage decreases linearly through the circuit from the phase terminal to the neutral end of the winding. As the voltage deceases so does the PD magnitude and the number of defects that produce PD.
- There is greater immunity to noise and disturbances from the power system with VHF and UHF methods, which lowers the risk of false indications of stator winding problems. Also this implies that less expertise is needed to perform and interpret PD results, since there is a lower risk the stator PD is obscured by the noise. This implies a lower marginal test cost. As a consequence, continuous PD monitoring is less likely to give false indications.
- With some of the VHF methods and all of the UHF methods, it is possible to locate with more certainty where the PD is occurring within the winding.
- Most capacitive PD sensors in VHF methods can meet the sensor reliability requirements stipulated in IEC 60034-27-2, thus reducing the risk that a PD sensor may fail the machine
- Peer-reviewed databases containing hundreds of thousands of test results have been summarized in tables of “high” and “low” PD. These severity levels have been confirmed by visual inspections on many hundreds of machines [22]
It is clear from the IEC standards that both the LF and VHF ranges can detect severe PD in a winding. The LF method tends to be preferred by OEMs and test service providers who have the expertise to separate the PD from the noise, and judge the severity based on experience with similar machines. Owners of machines tend to use the VHF and UHF methods since utility staff can perform the test and do a basic interpretation with relatively little training and experience.
On-line tests, high SNR (VHF or UHF with UWB) reduces risk of false indications
6.5 MATCHING BANDWIDTH FREQUENCIES
An instrument provider researched doing on-line PD data collection service using a LF instrument connected to existing 80 pF capacitive PD sensors [38]. 80pF sensors terminated in 50ohms provide a high-pass filter of ~ 40MHz. According to the data available for the LF PD monitoring instrument, the input frequency range is up to 20 MHz and bandwidth up to 3 MHz, and it has only one PD sensor input per phase (single ended installation). Note that VHF instruments have a bandwidth from 50 kHz to 350 MHz and when combined with the 80 pF capacitive PD sensor, the system bandwidth is 40 MHz to 350 MHz. The LF instrument configuration used a matching unit (basically an amplifier plus a low pass filter) intended to get from 80 pF PD sensors (EMCs), to a measuring range between 100 kHz to 500 kHz [38].
The measured background noise, the signal to noise ratio (SNR) of the LF instrument connected to the 80pF sensors is only 12% of the SNR from the typical 2nF PD sensors. The research shows that when the matching unit described above is used, the measurement is less reliable since the SNR from the connected 80 pF sensors gets worse and decreases to 11% of the SNR from the 2nF PD sensors. Thus it is clear from these tests that if a low frequency measurement system is used, it is best to connect it to a large capacitance, rather than try to force fit the instrument to a PD sensor made for high frequency applications.
Bandwidth frequency of the sensors should match that of the instrument
7 DISTURBANCES
Much of the noise or disturbances encountered in operating machines is not of the white sort, but is pulse-like, for example: corona on HV buses, switching noise, etc. Traditional filtering cannot completely remove such pulse-like noise, since, as described above, such signals will contain frequency components at all frequencies, especially if the noise pulse risetime is fast. Hence, any filtering of the noise pulses will also filter the PD, resulting in no net gain in SNR. It is apparent that alternative methods to filtering are needed to eliminate pulse-like noise [25]. Several methods have been developed based on time-of-pulse arrival from a pair of sensors, or on more complex differentiation of pulse shapes in the time domain [33], [35]. Such pulse discriminations are now widely used, and the required specialized sensors are installed in ~3500 machines. The discrimination techniques require the measurement of PD at high frequencies (≥40 MHz), since the fast risetime pulse characteristic of PD needs to be preserved so that it can be used as a precise riming signal, Of course, human experts observing data displayed on oscilloscope screens and spectrum analyzers, are also capable of separating the stator PD from the noise.
7.1 DIFFERENTIAL CONFIGURATION (HYDROS)
In a differential configuration, the installation is calibrated in such a way that a noise pulse will be detected at a pair of Iris Power 80 pF PD sensors (EMCs) at the same time. The Iris Power PDA-IV can resolve the pulse arrival time from a pair of sensors to <6 ns. PD originating near one sensor (C1 or C2) will arrive a significant time later at the other sensor. The differential configuration is employed in large hydro generators that have enough room to install PD sensors along the circuit ring bus. An instrument with only one input per phase, will be not able to discriminate the pulses from a pair of PD sensors as either coming from the parallel C1, coming from parallel C2, or noise. Thus such an arrangement will mean the results will be corrupted by electrical noise, greatly increasing the probability of a false indication (and unnecessary testing and stator repairs being planned). Alternatively a human expert (presumably from the vendor) will be needed to interpret all results, rather than the utility performing and interpreting their own tests – greatly increasing test costs.
7.2 DIRECTIONAL CONFIGURATION (MOTORS AND TURBOGENERATORS)
For machines with a small bore diameter (< 2 m) such as motors and turbogenerators, a pair of Iris Power 80 pF PD sensors (EMCs) is located outside of the machine along the output bus, in a directional configuration. It is called a directional configuration because pulses coming from beyond the bus segment between the PD sensor pair, arrive first to one sensor and a delayed time after, arrive to the second sensor. The PD sensor closest to the machine is named M and the PD sensor further down the system is named S. PD pulses coming from the stator winding arrive at the M sensor first and are classified by an instrument called the Iris Power TGA-B as stator PD. Otherwise, pulses are classified as noise (pulses from beyond S, and pulses between the pair of PD sensors). This differentiation between stator PD and power system noise occurs because it takes time for electrical pulses to travel, and the TGA-B can resolve the arrival time differences as short as 6 ns. An instrument with only one input per phase, will be not able to discriminate the pulses from a pair of PD sensors as either PD or power system noise. Thus it will be prone to false indications, and unnecessary testing and repairs on the stator.
7.3 STATOR SLOT COUPLER (LARGE TURBOGENERATORS)
The SSC is a two port directional electromagnetic coupler that is installed in slots of large turbo generators, either under the wedges, or between the two bars in the slot. An instrument with only one input per phase, will be not able to discriminate the pulses from the two port coupler as either PD from the slot, PD from the endwinding, or noise.
Sensor configuration is necessary to reduce influence of disturbances
8 COLLECTION OF DATA
8.1 PD TEST METHOD
During normal machine operation, the VHF instrument called the PDA-IV or TGA is temporarily connected to the previously installed sensors in each phase. The sensor blocks the power frequency voltage, and passes the high frequency voltage pulse accompanying partial discharge. To avoid any confusion with electrical noise from power tool operation, corona from the switchgear, RF sources, etc., the PDA-IV or TGA separates PD from system noise and disturbances on the basis of time-of-arrival and pulse characteristics, and measures the number, magnitude and ac phase position of the PD pulses.
8.2 DATA PRESENTATION
Two types of plots are generated for each partial discharge test. The first type of plot is two-dimensional (2-D), where the number of partial discharges per second versus PD magnitude is displayed. The greater the number of pulses per second, the more widespread is the deterioration in the winding. The higher the PD magnitude, the more severe is the deterioration. The second type of plot is three-dimensional (3-D), where the quantity (vertical scale) and magnitude (scale coming out of the page) of the PD versus the ac phase angle (horizontal scale) are displayed. Experience has indicated that such pulse phase analysis can be used to identify if multiple deterioration mechanisms are occurring, and what the mechanisms are.
The 2-D and 3-D plots are unwieldy for making comparisons amongst the machines. The PDA-IV or TGA summarizes each plot with two quantities: the peak PD magnitude (Qm) and the total PD activity (NQN). The Qm is defined to be the magnitude corresponding to a PD repetition rate of 10 pulses per second. Qm relates to how severe the deterioration is in the worst spot of the winding, while the NQN is proportional to the total amount of deterioration and is similar to the power factor tip-up. Since the Qm scalar quantity is more indicative of how close the winding is to failure, the peak magnitude (Qm) will be used throughout this paper for comparisons.
8.3 2015 DATABASE
After the accumulation of all available test data through 2015 with over 550,000 records from tests using portable instruments only, a database was carefully compiled using the following selection criteria:
- only on-line tests obtained during normal operation
- only on-line tests obtained during normal operation
- only one test result per sensor
- the most recent test at Full Load and Hot stator winding temperature (FLH)
- any test with questionable results was discarded
Once these criteria were applied, about 20,000 statistically independent test results from about 6,000 assets were analyzed.
The following tables show the breakdown of the results that were retained once non-FLH and repeat tests were discarded.
The appendix shows the updated statistical distribution of peak PD magnitudes for various voltage classes and sensor types.
8.4 STATISTICAL ANALYSIS
The database was analyzed to determine the effect on Qm of several different factors, including:
- Sensor installation
- Voltage class
- Hydrogen Pressure
The range in Qm from all the tests for the particular operating voltage was established for each set of the above factors. A sample of the statistical distribution is shown in Table 1. For example, for 13-15 kV stators in turbine generators or motors, 25% of tests had a Qm below 54 mV, 50% (the median) had a Qm below 120 mV, 75% were below 261 mV and 90% of tests yielded a Qm below 520 mV. Thus if a Qm of 500mV is obtained on a 13.8 kV motor or turbine generator, then it is likely that this stator will be deteriorated, since it has PD results higher than 90% of similar machines. In fact, in over two hundred cases where a machine was visually examined after registering a PD level >90% of similar machines, significant stator winding insulation deterioration was observed [22].
Table 1. Distribution of Qm for Air-Cooled Stators, 80 pF Sensors on the Terminals
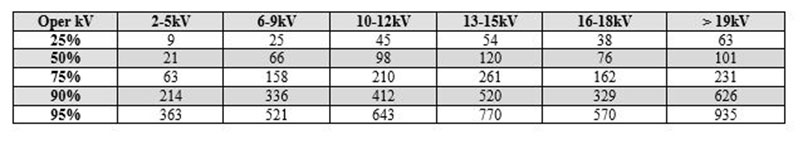 Table 2 illustrates the similar statistical distribution for hydrogen-cooled turbo generators where stator slot couplers (SSC) capacitors are installed. For these, both the operating voltage and gas pressure influence the results. Similar tables have also been prepared for air and hydrogen-cooled machines with other types of PD sensors and can be found in the appendix of this paper.
Table 2. Distribution of Qm for Gas-Cooled Stators using SSC sensors – Slot PD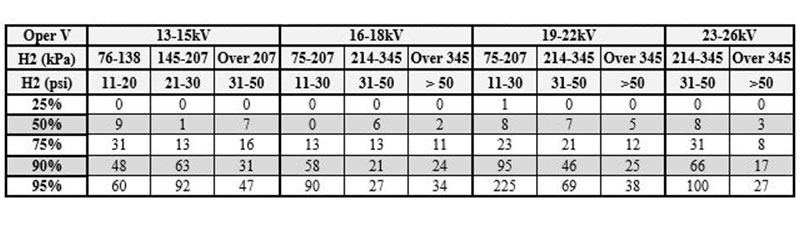 With these tables, it is now possible, with only an initial test for motor and generator owners, to determine if the stator winding insulation has a problem. If the PD is higher than that found on 90% of similar machines, then off-line tests and/or a visual inspection would be prudent. Continuous PD monitors should have their alarm levels set to the 75% for 4kV rated and below and the 90% level for above 4kV rated assets.
9 CONCLUSION
PD is a comparative test; however, judgments should only be done with data results that use the same sensors and test configurations. In addition, for accurate analysis, evaluations should include trends and comparisons to results from similar machines. In summary, the following issues should be considered when collecting and comparing results:
- Calibration for data standardization is not feasible – units are arbitrary, it is a comparison test.
- Calibration for data standardization is not feasible – units are arbitrary, it is a comparison test.
- Due to voltage impact to PD, PD sensors should be located near the first few coils in a stator winding
- PD occurs in frequencies up to ~300 MHz• Sensor configuration is necessary to reduce influence of disturbances
- Off-line tests should be done in LF range
- For on-line tests, high SNR (VHF or UHF with UWB) reduces risk of false indications
- Bandwidth frequency of the sensors should match that of the instrument
- Trending data alone can be misleading, as bad machines may have level trends. Overall magnitude relative to similar phases/machines is also significant.
- For accurate comparisons, PD trend data must be collected at the same frequency bandwidth.
- Comparison to the Iris database requires measuring at the VHF bandwidth. Otherwise, analysis will depend totally on the trend, which has a flaw, since eventually the PD levels off, even in bad windings.
Though it is always recommended that you trend the results for one machine over time and thus monitor the rate of degradation of the stator winding, it is also possible to compare results from similar machines. If the test instrument is a TGA, PDA-IV, Trac or Guard and the sensors are either 80pF capacitors, or stator slot couplers, then the tables contained within the appendix can be used to ascertain whether a machine warrants further tests and inspections or is operating within reasonable limits. Yellow flags should only be raised if the PD levels on a specific machine are above the 90th percentile (High). In all cases, raising the flag means increasing the frequency of PD testing to determine the rate of deterioration and when possible, conduct specialized tests, inspections and repairs as required. In mica-based insulation systems, PD is a symptom of a failure mechanism; action should be based on the severity of the failure mechanism detected by the PD, not the PD results. PD levels exceeding threshold alarms are warnings for further investigation to determine the cause of the high PD; however, be aware that PD levels can fluctuate with ambient and operating conditions. Maintenance should be based on the cause of the PD, not the overall levels. Continuous PD monitors should have their alarm levels set to the 75% or 90% level.
The time of winding failure is normally the result of a deteriorated winding being subjected to an extreme stress such as a lightning strike, out-of-phase synchronization, excessive starts, or system imbalance. As these are unpredictable, it is impossible to forecast when a failure will occur. However, by monitoring the PD characteristics of a stator winding, it is often possible to determine which machines are more susceptible to failure, and therefore which require maintenance.
10 REFERENCES
[1] J.F. Lyles, T.E. Goodeve, and G.C. Stone, “Using Diagnostic Technology for Identifying Generator Winding Maintenance Needs,” Hydro Review Magazine, June 1993, pp. 59-67.
[2] V. Warren, “How Much PD is Too Much PD?” Proc. Iris Rotating Machine Conference, Dallas, TX, March 1998.
[3] IEEE 1434-2014 “IEEE Guide to the Measurement of Partial Discharges in Rotating Machinery.”
[4] V. Warren, G.C. Stone, “Recent Developments in Diagnostic Testing of Stator Windings,” IEEE Electrical Insulation Magazine, September 1998.
[5] V. Warren, “Further Analysis of PD Test Results” Proc. Iris Rotating Machine Conference, Scottsdale, AZ, March 1999.
To [21].…. V. Warren, “Partial Discharge Testing – A Progress Report” Proc. Iris Rotating Machine
[22] Maughan, C.V. “Partial discharge-a valuable stator winding evaluation tool”, Electrical Insulation, 2006. Conference Record of the 2006 IEEE International Symposium on, On page(s): 388 – 391
[23] IEC 60270, “High Voltage Test Techniques. Partial Discharge Measurements.”, 2015
[24] IEC TS 60034-27, “Off-line partial discharge measurements on the stator winding insulation of rotating electrical machines”, 2006
[25] IEC TS 60034-27-2 “On-line partial discharge measurements on the stator winding insulation of rotating electrical machines”, 2012.
[26] G.C. Stone, V. Warren, “Objective Methods to Interpret Partial-Discharge Data on Rotating-Machine Stator Windings” IEEE Transactions on Industry Applications. Vol.42, No.1, January/February 2006, pp 195-200.
[27] G. C. Stone, “Calibration of PD Measurements for Motor and Generator Windings–Why It Can’t Be Done,” IEEE Electrical Insulation Magazine, 9-12, January 1998.
[28] IEC 62478, “High Voltage Test Techniques – Measurement of Partial Discharges by Electromagnetic and acoustic Methods”, 2016
[29] I. Kemp et al, “Calibration Difficulties Associated with PD Detectors in Rotating Machines”, Proc IEEE Electrical Insulation Conference, October 1987.
[30] G. C. Stone and S. A. Boggs, “Wide Band Measurements of PD in Epoxy”, IEEE International Symposium on Electrical Insulation, pp. l37-141, 1982.
[30] G. C. Stone and S. A. Boggs, “Wide Band Measurements of PD in Epoxy”, IEEE International Symposium on Electrical Insulation, pp. l37-141, 1982.
[31] D. Lightle, B, Hampton, and T. Irwrn, “Monitoring of GIS at Ultra High Frequency”, Proc. 6th International Symposium on HV Engineering, Paper 23,02,1989.
[32] G.C. Stone, H. G. Sedding and N Fujimoto, “Practical Implementation of Uttrawide Band PD Detectors”, IEEE Trans El, pp. 70-77, February 1992.
[33] G.C. Stone, “Importance of Bandwidth in PD Measurement in Operating Motors and Generators”, IEEE Transactions on Dielectrics and Electrical Insulation, Vol. 7, No. 1, February 2000 (Pages 1131–1137).
[34] S. A. Boggs and G. C. Stone, “Fundamental Limitations in the Measurement of Corona and PD”, IEEE Trans EI, pp 143-150, April 1982.
[35] H. G. Sedding and et. al., “A New On-Line PD Test or Turbine Generators”, CIGRE, Paper 11-M3, September 1992.
[36] G, C. Stone and S. R. Campbell, “Digital Methods of Eliminating Noise in On-Line Generator PD Measurements”, IEEE Winter Power Meeting, Publication 92-THO-425-9-PWR, February 1992, RP 76–17 Part II.
[37] G.C. Stone, H.G. Sedding, M. Teixeira, “Comparison of Low Frequency and High Frequency Partial Discharge Measurements on Rotating Machine Stator Windings”, SNP TEE, 2017.