
Presented at NETA PowerTest Conference 2014, Denver, CO
ABSTRACT – In recent years, stator endwinding vibration has developed into a significant failure mechanism of large motors and generators. In some cases, driven by end users to reduce costs, manufacturers have used insufficient stator endwinding support. This lack of support has led to excessive motion between parts resulting in abrasive damage and high cycle copper fatigue resulting in cracked conductors.
During maintenance outages, visual inspection identifying dusting, insulation fretting, and greasing are indications that endwinding vibration is present. There is an offline test, the impact test, that can determine the most “relaxed” areas of the endwinding where vibration would likely be the highest and therefore more damaging to the winding. The test itself consists of impacting a particular part of an endwinding structure with a calibrated force and measuring its overall response with a temporarily installed accelerometer. As with any offline test on electrical machinery, there are proper procedures that should be followed in order to ensure valid information. In order to avoid premature failure in the stator endwinding, excessive motion and vibration in “relaxed” areas should be monitored during operation using permanently installed accelerometers. There is a practical limit to the number of accelerometers to use and this impact test can be utilized to determine the optimal sensor locations and thus maximize the benefit of monitoring stator endwinding vibration.
This paper describes common problems caused by endwinding vibration, the offline “impact” or “bump” test and the online monitoring system using practical case studies for each.
I. Background
II. Impact Test Preparation
A. Force Hammer
B. Accelerometer
III. Test Procedures
A. Driving Point
B. Modal Analysis
IV. Case Studies
A. Case Study 1 – Temperature Effects on Stator Endwinding Natural Frequencies
B. Case Study 2 – Stator Endwinding Vibration and Impact Testing
C. Case Study 3 – Stator Endwinding Harmonic Vibration and Impact Testing
V. Conclusion
VI. References
VII. Vita
BACKGROUND
The stator endwinding allows for safe electrical connections between bars in series and to other parallels. These connections must be made away from the stator core to prevent insulation failure at the connection points. On higher voltage machines, the required creepage distance between the core and the connections can become quite long. Additionally, higher speed machines have long endwindings for geometric reasons, e.g. 2m or longer is not uncommon [1]. The long unsupported lengths of endwinding bars, particularly on high speed machines are susceptible to excessive motion resulting in vibration.
The dynamic response of stator endwinding bars resulting in vibration can be attributed to two primary forces. The main force is the electromagnetic frequency at twice power frequency (100Hz/120Hz). This is generated from the magnetic fields that are produced between two parallel current-carrying conductors. The electromagnetic forces between two adjacent bars are proportional to the square of the current [2]. Harmonics of this force can occur from the power system currents that excite the stator endwindings resulting in vibration at exact multiples of this fundamental frequency. Another force on a stator endwinding during normal operation is at turning speed: 50/60 Hz for 2-pole machines and 25/30 Hz for 4-pole machines.
These forces can be measured in three directions. Considering the end view of a stator these are normally specified as radial, tangential (or circumferential), and axial. Figure 1 shows the radial and tangential directions as a reference with the axial direction into the page. For the electromagnetic force the directions of most concern are radial and tangential. This is because the force is generated by two parallel current-carrying conductors, i.e. the force between the top and bottom bar (radial) and between two adjacent bars (tangential) [2]. The force in the axial direction is usually negligible.
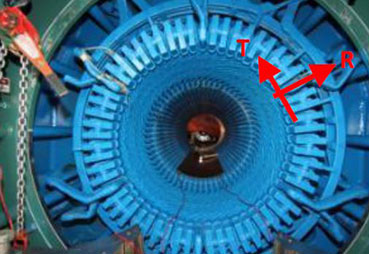
Figure 1. End View of Generator Stator with Radial (R) and Tangential (T) directions
To accommodate for these forces during operation, each bar is often lashed to a support ring made of insulated metal. The hoop strength of the support ring prevents movement in the radial direction. Insulated blocks placed between adjacent bars prevent movement in the circumferential direction. Depending on the length of the endwinding, one or more rows of blocking may be present [1]. See Figure 2 for an example of such a support system.
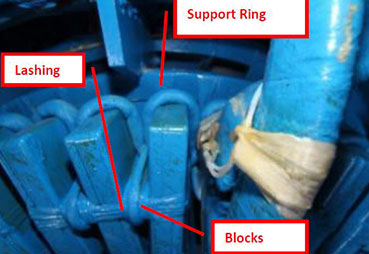
Figure 2. Stator Endwinding Support System: Ring, Blocks, Lashing
Many system disturbances or frequent starts will create large transient forces and may accelerate the wear rate of components [1]. Age is another factor that will contribute to endwinding vibration as the insulating blocking and bracing material shrink over time loosening the endwinding support and resulting in excessive motion. Stator endwinding natural frequencies tend to decrease as the structure loosens with age and operation. As well, the structure tends to become more heavily damped resulting in the natural frequencies covering a wider range than in a new or recently repaired endwinding structure. If these changes in the endwinding natural frequencies come to influence the operating forces of a machine, the vibration will be resonant resulting in excessive vibration reducing the life of the stator endwinding structure significantly [2].
Properly scheduled visual inspections are an important requirement to detect any evidence of excessive motion. Periodic offline tests such as impact (or bump) testing can provide an indication of how the structural characteristics of a stator endwinding change over time.
IMPACT TEST PREPARATION
Purpose: To excite the natural frequencies of a stator endwinding when the machine is offline the analyst can strike the structure with a calibrated force and measure the resulting response. Many tools are readily available for these tests, but important factors need to be considered.
Force Hammer
A force hammer, red tip in Figure 3, is used to excite the stator windings while the measured responses in acceleration from around the endwinding can be compared. The advantages of using a force hammer are the speed of testing, ease of setup, portability, and cost. These factors make a force hammer highly suitable for field work whereas a shaker is more suitable for lab testing. This is a comparison test so repeatable hammer strikes are required. This can be achieved by ensuring to strike with the entire hammer tip surface (for an even strike), avoiding double impacts (for one strike), and ensuring enough energy is generated to excite the structure (for a solid strike). An experienced analyst will have a “calibrated” swing resulting in excellent repeatability.
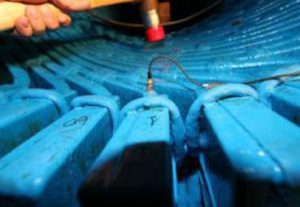
Figure 3. Impact Test Setup with Force Hammer and Accelerometer
A precaution when using a force hammer is to avoid “driving the system” by over exciting or impacting too hard. This can result in frequency shifts as shown in Figure 4 where there is a 2 Hz decrease at 110 Hz. The aim of impact testing is to measure the natural frequencies of the endwinding structure itself and any changes in dynamics due to improper test procedures will result in inaccuracy.
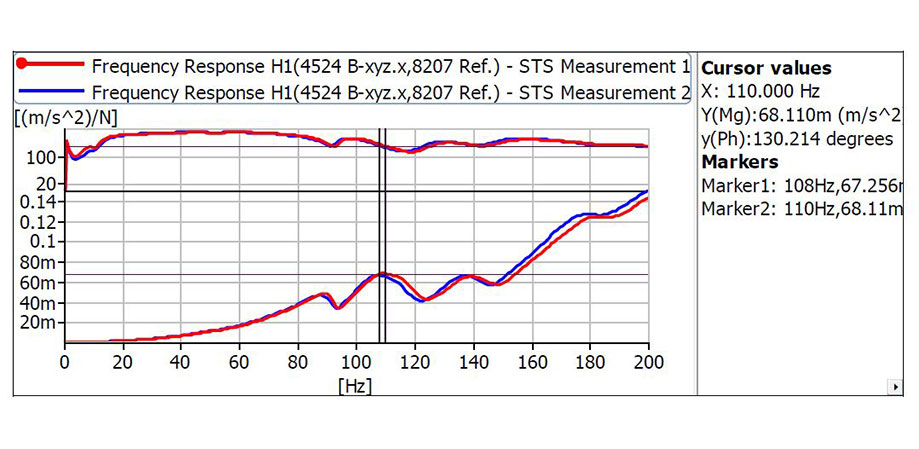
Figure 4. Frequency Shift as a Result of Driving the System in Measurement 2 (blue)
Accelerometer
An accelerometer, grey cube with black signal cable in Figure 3, is used to measure the response due to the excitation by the force hammer. Locations with higher acceleration response due to the same force can be expected to vibrate at higher amplitudes during machine operation. Considerations when selecting a sensor for this testing are type, axis, and mounting.
Conventional piezoelectric accelerometers are suitable for this testing as the machine is offline and there is no risk of compromising electrical clearances with metallic components in a high voltage area that is found during machine operation. The frequency range of the accelerometer is governed by the natural frequency of the sensor itself. Generally, the smaller the physical size of the sensor, the higher the natural frequency. Considering we are locating frequencies in the few hundred Hz range, general purpose accelerometers with maximum
frequency ranges of a few kHz or more are suitable and readily available.
Single axis accelerometers are easier to work with, but tri-axial accelerometers provide more information by collecting data in 3 directions simultaneously. Because we are interested in natural frequencies in the radial and tangential directions in stator endwindings, this decision becomes a balance of time (more time with single axis) and bookkeeping (more data with triaxial).
Poor mounting techniques of the accelerometer can result in poor results. The main requirement is for close mechanical contact between the accelerometer and the surface to which it is being attached. This will ensure the excitation forces are completely transmitted from the component surface to the accelerometer. Additionally, the response from the accelerometer’s natural frequency should not be measured within the endwinding structure natural frequencyrange. The type of sensor mount affects the accelerometer’s natural frequency. The more rigid (stiff) the mount, the closer the measured natural frequency will be to the accelerometer calibrated value. This can be achieved by stud or cement mounting; however, general purpose accelerometers typically have a natural frequency in the 5-10 kHz which far exceeds the frequency range of interest for stator endwinding impact testing. With this in mind, a more practical mount for stator endwinding testing is beeswax. Even though wax results in a reduced usable frequency range the frequencies of interested are in the few hundred Hz range and still well within the usable range of a wax mounted general purpose accelerometer. Wax provides a quick mount on a variety of surfaces. The cleaner the surface the better the wax will stick. The only practical consideration is at higher temperatures (e.g. >100°F) the wax can sometimes become soft and not stick.
TEST PROCEDURES
The goal of impact testing is to establish a dynamic signature for the structure by doing Fourier analysis. There are two impact test procedures that can be used to establish the natural structural characteristics of a stator endwinding structure: Driving Point and Modal Analysis.
Driving Point
In the Driving Point test, the force hammer and the accelerometer are at the same measurement location, as shown in Figure 3. The measurement location is regarded as where the maximum deflection signals can be obtained and selected by the analyst. The result is a measured response at the excitation point or frequency response function (FRF). This transfer function is expressed in the frequency domain. [3]
The phase will be between 0 and 180 degrees or 180 and 360 degrees and be ~90 degrees at a natural frequency. Two observations are required to identify a natural frequency. As a driving frequency approaches an undamped natural frequency, 1) the magnitude approaches a maximum and; 2) a phase shift crosses through 90° [3]. To identify natural frequencies these observations can be determined with impact testing. See Figure 5.
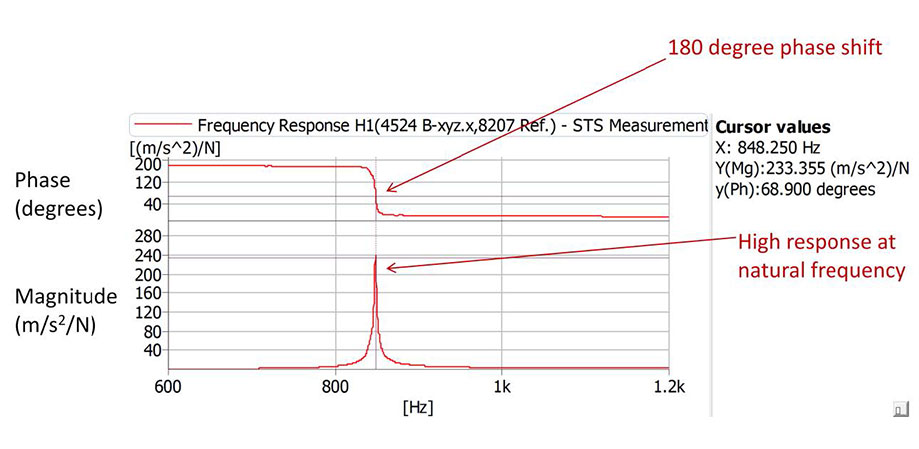
Figure 5. Natural Frequency Example
The critical bands for a motor or turbine generator are around rotational speed frequency and twice line frequency. Therefore, applied forces in the endwinding structure of a 2-pole, 50/60 Hz generator are at rotor rotational frequency, 50/60 Hz and at alternating load current electromagnetic forces, 100/120Hz. The concept of critical band refers to the risk of vibration amplification when the structure natural frequencies are close to the forcing frequencies. In service, the natural frequencies may drift in the bands due to temperature, aging and other variable factors. Thus, an acceptance band should be defined with these factors in mind. The acceptance criteria are based on the magnitude of the acceleration over force through the critical excitation bands.
The impact test should not be considered as a stand-alone test or replacement to a Modal analysis test.
Modal Analysis
Modal analysis consists of measuring motion at various points of a structure when it is excited by some driving force. The pattern of motion usually takes certain shapes which are related to the natural frequencies or natural motion tendencies of the structure. This provides a definitive description of structural characteristics through curve fitting techniques to generate a shape table that closely represents the dynamics of a structure.
Modal analysis assumes the structure is linear. This means that the response will be proportional to the input force. This can be checked by performing a driving point test with different sizes of force hammers and obtaining the same FRF. As well, modal analysis assumes that the test is time invariant; the parameters are constant during the test. Ambient and winding temperature should be recorded through impact testing and not fluctuate significantly. Finally, modal analysis assumes passivity. To ensure that all response is due to the measured forces, it is best to perform impact testing when background/operational forces are a minimum.
An endwinding structure can be modeled with a circular ring. When the structure takes certain shapes at similar frequencies to a force, the resonant condition amplifies the vibration on an endwinding. For a 2-pole machine the shape for twice supply frequency deflection is oval. This shape is not the only mode that can be excited by forces within the rotating machine. Other modes such as cantilever modes (the whole endwinding bouncing up and down) or breathing modes (expanding and shrinking diametrically) could also become resonant if forces act on the winding in the critical directions and at the critical frequencies. However, the oval mode shape in Figure 6, for 2-pole machines is the most critical for vibration analysis of the stator because it naturally gets driven by the rotor forces if the resonant frequencies are close to the rotor forcing frequencies. For reliable operation of rotating machines, it is critical that natural frequencies for the mode shapes into which the endwinding can be deformed are far away from the driving frequencies (120 Hz).
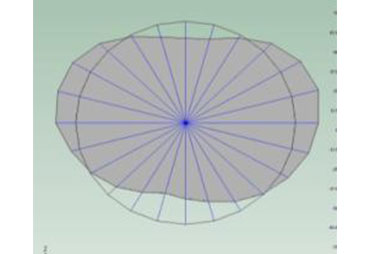
Figure 6. Critical Mode Shape for 2-pole Machine
When performing modal analysis, enough points must be measured to resolve the mode shape of interest. In general, for 2-pole machines 12 points are sufficient to define the oval mode shape, but for slower machines more points are required to define the appropriate mode shapes. The 24 points used to collect Figure 6 offer more resolution.
CASE STUDIES
Case Study 1 – Temperature Effects on Stator Endwinding Natural Frequencies
Structural characteristics change with age resulting in a decrease to the natural frequencies and heavier damping. This effect is similar when the temperature of a stator endwinding structure increases. This is an important consideration when using offline impact testing which is generally performed at a much lower temperature than operation.
As winding temperatures increase, the stiffness of the endwinding structure decreases [2]. The standard undamped natural frequency (fn) relation is:
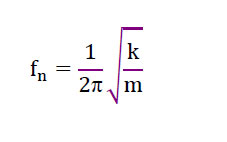
Where k is stiffness and m is mass.
From this equation it can be seen that a decrease in stiffness results in a decrease in the natural frequencies of the structure [2]. If a vibration component is influenced by a natural frequency, the response (or vibration amplitude) will be affected by a change in winding temperature. Because of the inverse relationship between winding temperature and natural frequency, an increase in temperature to a system that is low tuned (meaning the natural frequency is below the forcing frequency) may decrease the vibration amplitude because the natural frequency moves further away from the forcing frequency and influences it less, if at all. This is the ideal condition for critical mode shapes. Conversely, a high tuned system (meaning the natural frequency is above the forcing frequency) may increase in vibration amplitude with an increase in winding temperature as the natural frequency decreases and moves into the forcing frequency and influences it more. This frequency shift can be quite dramatic at higher temperatures as the elastic quantity for epoxy mica insulation decreases significantly when the winding temperature is beyond a transition temperature of around 80°C [5]. This was demonstrated experimentally [6] in which mode shape tables were produced from impact data collected on stator endwindings in cold, warm, and hot conditions.
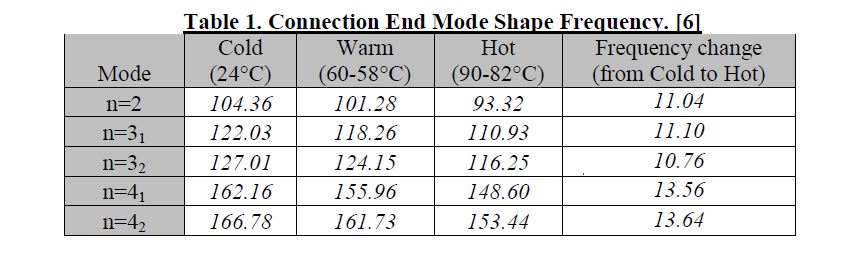
This experimental data indicates that even though the mode shape frequencies measured were affected by the temperature of the windings, the mode shapes themselves were not. Figure 7 displays the oval mode shape in the cold and the hot conditions overlaid. The frequencies decreased with temperature by more than 10 Hz [6]. This is important when establishing the condition of stator endwindings with offline testing. Generally, a 10% band can be used to cover for the dampening effect of natural frequencies, but a wider band may be necessary to account for temperature, as shown in this experiment.
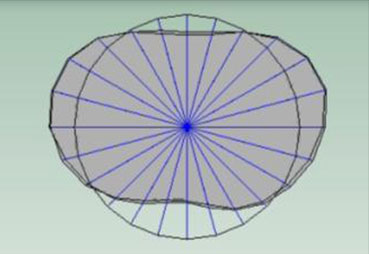
Figure 7. Oval Mode Shape in Hot and Cold Condition Overlaid [6]
Case Study 2 – Stator Endwinding Vibration and Impact Testing
It is impractical to monitor every component of a stator endwinding and some care is required to identify the optimal locations. Once the locations for monitoring have been properly identified, the offline impact test data can indicate the resulting frequency content and relative amplitudes of the online vibration data. It is widely considered that the connections are the most important locations to monitor endwinding vibration. They are generally more massive and the long unsupported lengths increase the likelihood for resonance and high vibration amplitudes.
Figure 8 shows offline impact test data on a connection that identified a natural frequency around 320 Hz (lower than a harmonic of the forcing frequency of 360Hz). The two characteristics can be identified near this frequency; high magnitude, 0.015 g/N in the lower plot and phase shift crosses through 90° in the upper plot. From Case Study 1, these natural frequencies are expected to shift down at operating temperatures. This 60 Hz machine has primary forces at 60 and 120 Hz, as well as power frequency harmonics in harmonics of 120 Hz. The natural frequency identified is not expected to influence these forces and harmonics significantly.
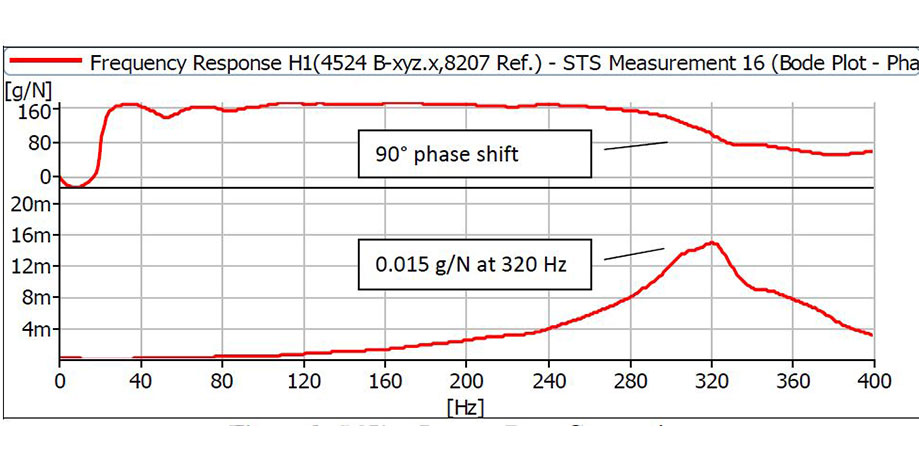
Figure 8. Offline Impact Data Connection.
The resulting online acceleration data in Figure 9 showed dominant peaks at 120 Hz from the electromagnetic force with multiples at 240 and 360 Hz. Harmonics are generally expected to decay linearly if not influenced by resonance as the force dissipates out of the system, as is the case for this machine. Note that because the offline natural frequency from Figure 8 was not within the forcing frequency range, then it does NOT go into resonance when online, so is not
visible in Figure 9.
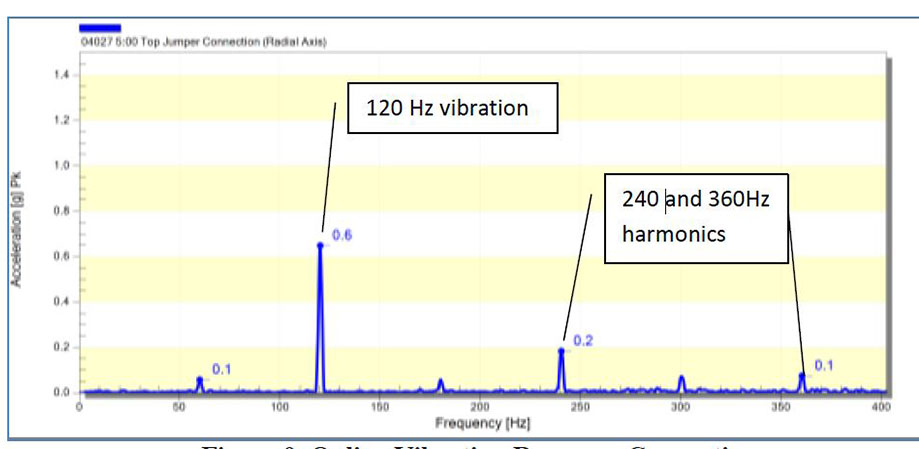
Figure 9. Online Vibration Response Connection.
Case Study 3 – Stator Endwinding Harmonic Vibration and Impact Testing
Figure 10 shows offline impact test data collected on a winding bar on the same machine
as above in Case Study 2. The test identified natural frequencies near 211 and 392 Hz. Again, the two characteristics can be identified near 211 Hz frequency; high magnitude, 0.011 g/N in the lower plot and phase shift crosses through 90° in the upper plot. The natural frequency near 392 Hz has high magnitude, 0.020 g/N in the lower plot and phase shift crosses through 90° in the upper plot (higher than the harmonic forcing frequency of 360 Hz).

Figure 10. Offline Impact Data Winding.
The resulting online acceleration data in Figure 11 showed dominant peaks at 120 Hz from electromagnetic force with multiples at 240 and 360 Hz. Because these harmonics are influenced by a natural frequency, they do not decay linearly as seen on the connection in Case Study 2. The high amplitude at 360 Hz is due to a resonant response. The system at this winding location is approximately eight times more responsive at 360 Hz than at 240 Hz and the online vibration data behavior showed this correlation.
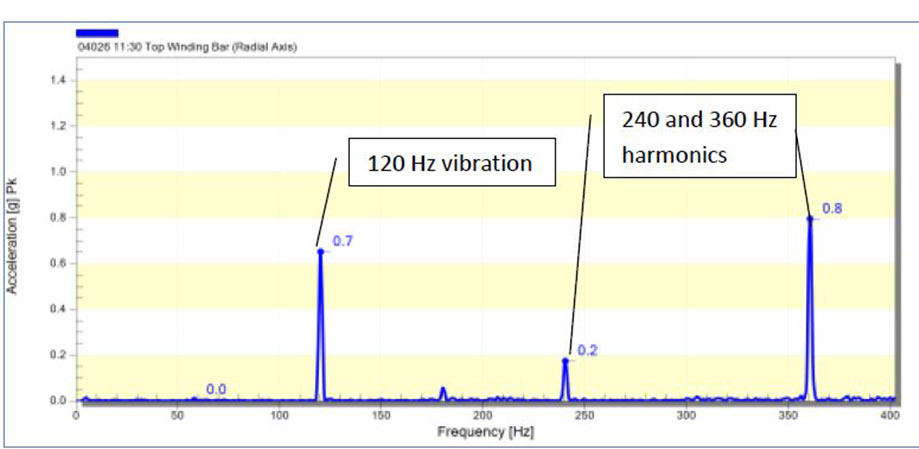
Figure 11. Online Vibration Response Winding.
The driving frequency (electromagnetic force) at 120 Hz is similar at both locations. This is readily apparent by comparing response amplitudes, 0.6 g pk on the connection and 0.7 g pk on the winding, and considering there is minor sensitivity from the impact test data at both locations. The vibration amplitude at 360 Hz is significantly greater on the winding compared to the connection due to a local natural frequency identified on the winding that is influencing this response.
This demonstrates the importance of impact testing to determine the optimal locations. High sensitivity measured with offline testing in critical frequency bands should be considered for online vibration monitoring as these are the locations that are most likely to vibrate. The data presented shows that even though the connections are generally considered the critical components for monitoring vibration, the windings are a more suitable sensor location for this particular.
CONCLUSION
Stator endwinding vibration has developed into a significant failure mechanism attributed partly to the efforts by manufacturers driven by end users to reduce costs and additionally, on load cycling machines, with demand fluctuations. Consequently machines are being operated with insufficient stator endwinding support leading to excessive motion between parts and ultimately cracked conductors due to high cycle copper fatigue. In order to avoid premature failure, this excessive motion during operation should be monitored and repaired. As shown by the case studies in this paper, an effective online monitoring system requires the sensors to be installed at locations most likely to vibrate.
Impact testing is an offline test that can be used to assess whether stator endwindings are likely to vibrate in resonance with operational forces and optimize the location of the accelerometers for monitoring. When performing any offline test on electrical machinery it is important to choose the right tools for the job. For impact testing a calibrated force hammer is used to measure the excitation input and an accelerometer is used to measure the response output. Appropriate practices should be implemented when collecting data. Avoid frequency shifts from mounting errors to ensure good correlation between the force hammer and the accelerometer.
REFERENCES
- G.C. Stone, E.A. Boulter, I. Culbert, et al. Electrical Insulation for Rotating Machines. Hoboken NJ: Wiley, 2004, pp. 29-30, 172-174.
- H.O. Ponce, B. Gott, G. Stone, Generator Stator Endwinding Vibration Guide: Tutorial, EPRI, 2011. Project Evaluation No 6382.
- Inman, D.J. Engineering Vibration. 2nd Ed. Upper Saddle River, NJ: Prentice Hall, 2001, pp. 102-106, 508-509.
- Hewlett-Packard, Appl. Note 243, pp.34-39.
- A. Jarosz, A. Foggia, J. Adam, et al. Mechanical behavior of hydrogenerator endwindings, in Proc. IEEE-IEMDC, 1999, pp. 308-310.
- M. Sasic, H. Jiang, G.C. Stone. Requirements for Fiber Optic Sensors for Stator Endwinding Vibration Monitoring, in Proc. IEEE-CMD, 2012, pp. 118-121.