
Presented at HydroVision July 28, 2016, Minneapolis, MN
SUMMARY
A condition-based maintenance strategy involves monitoring the condition of a system so that maintenance can be planned effectively and repairs can be performed efficiently. Online monitoring in a condition-based maintenance strategy requires the installation of sensors to detect change of a specific aspect of a system. A monitor can be used to efficiently collect data such that less data is being stored during steady states and more data is being stored during transients. This strategy can be applied to hydro power plants to detect most aging related problems that occur in generators well before machine failure [1]. With this information, plants are better equipped to schedule and plan maintenance outages.
This paper examines a hydro generator where a loose rim problem was identified after refurbishment work that included changing the rotor poles, as well as incorporating additional sensors to the condition-based monitoring system. This condition was identified using data from air gap and flux monitoring collected in various modes of operation. Analysis of the system database revealed that the generator often goes to over speed (up to 150% of rated RPM) putting the rotor under significant stress and could lead to more severe rim loosening or even worse – cracks in rim segments. Therefore, on-line continuous monitoring and data analysis is very important to ensure machine safety. This paper describes the data interpretation, problem identification, as well as the recommendations for future activities related to machine condition monitoring. The severity of faults that occur due to air gap problems was experienced in a small plant where a stator and rotor rub caused significant damage to both the stator and rotor.
Introduction
On line air gap measurements provide data about generator stator and rotor centre positions and their circularity (or roundness) values which strongly influence the dynamic behavior of the generator and are essential for smooth machine operation. These measurements are an important component of machine condition monitoring, reliably providing specific and important information which cannot be simply obtained by some other method.
Besides simply analyzing the air gap, there are many interesting things that can be identified as a root cause of occurring problems that are manifested by high vibration or some other irregularity. Depending on the number of installed sensors, an air gap analysis can include the identification of the following parameters:
- Rotor geometry / roundness
- Stator geometry / roundness
- Rotor concentricity
- Stator concentricity
- Rotor center both dynamic and static from reference position
- Stator center from reference position
To be able to fully analyze the air gap a minimum of 4 sensors spaced at 90 degree intervals are required. The recommended number of sensors will vary from machine to machine depending on stator inner diameter and core height, as on taller stator cores differences between upper and lower dimensions are to be expected.
The complete solution consists of:
- Minimum 4 capacitive air gap sensors
- Synchronization sensor (key phasor)
- Real time (data collection) processor
- Server PC (database and analysis software)
- Magnetic flux sensor
- Active and reactive power (to correlate the data with operating conditions)
An overview of a typical system is shown in Figure 1.
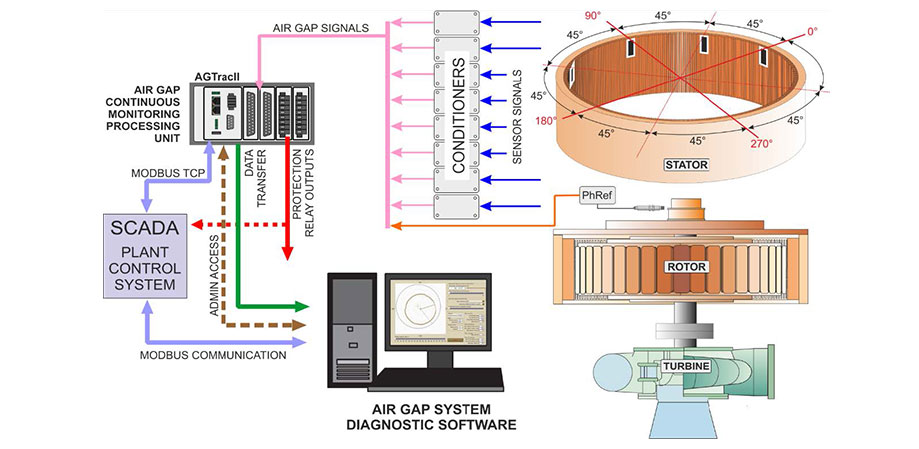
Figure 1. Typical configuration of the air gap monitoring system
The majority of problems that can be identified with air gap monitoring are related to irregularities in the geometry of the rotor and stator and the worst case scenario is a stator and rotor rub which leads to significant damage and loss of production.
Previous experience of the worst case scenario on a smaller unit was the driving factor to equip an on-line air gap monitoring and diagnostic system on more critical units in the fleet.
Rotor Rub and Damage
A stator and rotor rub occurred on a smaller unit in the same fleet which led to severe damage and a long (and expensive) shutdown.
Machine data:
- P – 525 kVA
- Voltage . 2.3 kV
- RPM – 120 (60 poles)
- # if stator slots – 360
- Stator insulation: Epoxy/Resin-Mica
The rub occurred due to bearing failure and resulted in the formation of inter-laminar short at the impact location. Most of the pole faces of the field pole pieces also had some iron damage and overheating due to contacting the stator core. There was extensive damage to about a quarter of the stator wedges. There was a heavy coating of metals shavings and carbon dust contamination on the field rotor poles, the stator windings and the stator core. The severity of this failure is shown in Figures 2 to 4.
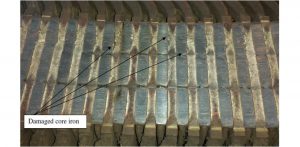
Figure 2. Mechanical damage to the laminated core iron
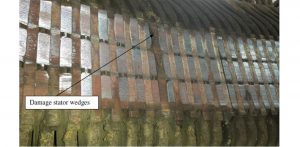
Figure 3. Damaged stator core iron and wedges
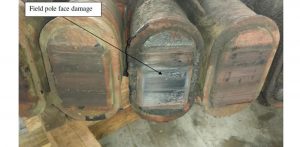
Figure 4. Mechanical damage to field pole face
OEM Inspection on Unit B Before Stator Rewind
During the rewind outage, all 72 field poles of unit B were removed from the rotor rim for inspection and rehabilitation. The contractor field services personnel experienced difficulty in removing the field poles due to galling of the field pole keys and damaged laminations. There was evidenced of significant heat damage to the poles, particularly in the damper winding and lamination in the T-tail regions.
It was known that this unit had experienced a motoring event in 2008, during which the poles might have been subjected to rotating magnetic field of the stator. The event might have lasted several minutes, during which high currents might have been induced in the damper windings. After the fault in 2008, the rotor and stator passed maintenance electrical tests and was return to service.

Figure 5. Damage to rotor rim and laminations
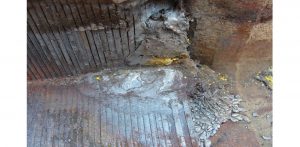
Figure 6. Melted field poles laminations
During the rewind outage, rotor pole air gap was measured within a tolerance of +-5%. The unit has 72 rotor poles and 567 stator slots. To take the air gap data, probes were mounted on the rotor looking at the stator between poles 23 and 24. The unit brakes were released, the thrust bearing high lift pump was turned on, and the rotor was manually rotated in the clockwise direction. The following table shows the air gap test results compared with the designed data.
Table 1. Air gap values measured and designed.
| Air Gap | Measured | Designed | ||
| Max (mm) | Min (mm) | Average (mm) | (mm) | |
| Top | 16.68 | 15.43 | 15.94 | 17.32 |
| Bottom | 17.04 | 15.79 | 16.31 | 17.47 |
Installed Monitoring System Description
As a result of this damage, two of the more critical units in the fleet were equipped with air gap and magnetic flux monitoring. A Condition Monitoring and Diagnostic System (CoDiS) was installed and commissioned in May 2013 (for unit A) and May 2014 (for unit B) and included 4 air gap sensors, one flux sensor, and one shaft trigger sensor for calculating rotational speed. These generators are umbrella type with a combined generator bearing and Francis Turbine with the following basic data:
- P = 212.5 MVA
- 2 guide bearings (1 upper and 1 combined thrust and guide generator bearing) – umbrella type
- V = 13800V
- I = 8890 A
- N = 100 rpm (60Hz)
- Francis turbine Rotor diameter – 13.8m, Rated air gap – 19mm
- Shrunk RIM and Rotor spider has 12 arms
Both units were refurbished including complete stator and rotor rewind in the scope of work. All the poles were rewound and reassembled on the rim after the rewind. On both units the monitoring system was in operation during machine commissioning and recorded data from the first rotation through different operating conditions. The following operating regimes were captured:
- Slow roll (below 50% of RPM)
- Free run (from 50-100 %)
- Field flash (up to 100% of excitation)
- Load rejection/overspeed (on unit A only)
Preliminary analysis indicated that one part of the rotor showed signs of a loose rim section on unit B. Detailed analysis of the data recorded on the monitoring equipment detected that the rotor geometry changed with increasing speed and the field flashing. The results were compared to the data recorded by the monitor on unit A which also had several overspeeds of up to 150% nominal speed.
Analysis and Identification of Machine Condition
There were two types of analysis performed on both unit A and B during commissioning of the machine after refurbishment (this is a standard type of analysis on CoDiS system commissioning):
- Analysis of recorded history trends
- Post processed event analysis (alarms or user created events) which were used for obtaining the polar plots of the stator and rotor shapes and geometry as well as for the magnetic flux pole profile.
History trends are used to display long term records of values that were calculated in real time and recorded continuously. Trended values (also called condition vectors that are referenced to the phase reference signal), were stored as follows:
- With maximum resolution during transient events (e.g. every second or every two seconds depending on the machine speed). This resolution can be set by user request, and it is primarily used to record the run up or coast down events as well as the alarm events.
- Once per minute (or longer if required) in steady state conditions
Transient Trend Analysis
Preliminary analysis on Unit B showed a difference between the Maximum and Minimum air gap value on each sensor at 100 RPM and 20 RPM. Figure 7 shows this difference between the minimum and maximum value changing with the speed. During the transient, the difference between these two values changed from 1.5 mm to 0.5mm on both sensors indicating that the rotor geometry changed significantly with centrifugal (and magnetic) forces causing rim deformation.
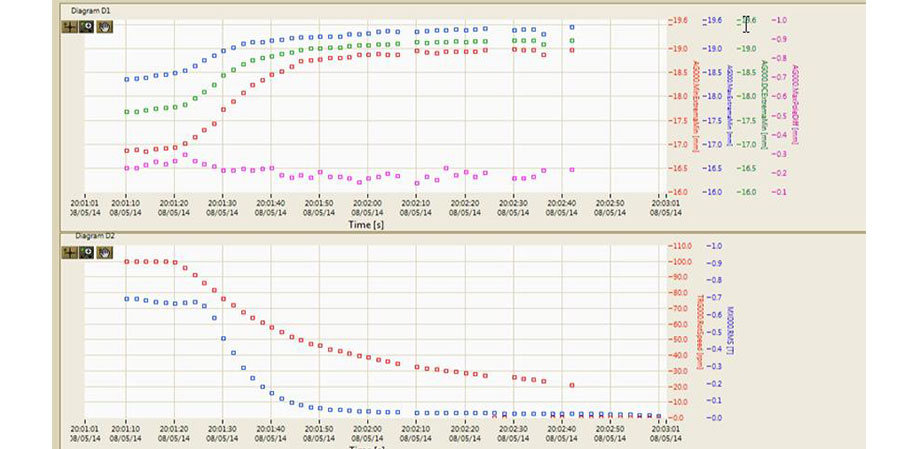
Figure 7. Unit B Coast down Upper diagram – AGmin (red), AGmax (blue), AGmean (green), AGmax.diff (purple) in mm for AG000; Lower diagram – rotational speed (red) in rpm, magnetic flux (blue) in T
Legend:
AGMin – minimum air gap value on one sensor
AGMax – maximum air gap value on one sensor
AGmean – average air gap value on one sensor
AGmax.diff – maximum difference between two adjacent poles
Figure 7 shows the trend values (condition vectors) at sensor AG000 (position 0° downstream) which points to uneven changes in the air gap during the coast down event.
Table 2. Values at 100 RPM (beginning of the transient on Figure 5) for AG000
| Signal | Value | Value |
| RPM (red curve at lower diagram) | 100 | 19 |
| Agmax (mm) (blue curve at upper diagram) | 18.4 | 19.5 |
| Agmin (mm) (red curve at upper diagram) | 16.9 | 19 |
The difference between these two values change from 1.5 mm to 0.5mm during the coast down indicating that the rotor geometry changed significantly with the centrifugal (and later with magnetic) forces causing rim deformation. The conclusion was that the radial stiffness of the rotor body (rim or pole joints) was not symmetrical. For comparison the same values recorded during a coast down event on unit A in Figure 8 shows no indication of similar problems.
Figure 8. Unit A Coast down Upper diagram – Agmin (red), AGmax (blue), AGmean (green), AGmax.diff (purple) in mm for AG000; Lower diagram – rotational speed (red in rpm, magnetic flux (blue) in T
Comparison of Data in Different Operating Regimes
After the potential problem was detected it was decided to analyze and compare the data in different operating regimes to help indicate the significance of the problem.
A reference point for the rotor center was selected in mechanical free run at 60% of nominal speed. At this speed there was no significant influence of centrifugal forces on the rotor, but the oil film in the bearing kept the rotor in its center. In this regime there are no other forces on the rotor or stator except residual mechanical unbalance.
Rotational center of the rotor is ideal in the bearing as well as in the air gap between the rotor and stator. Any run out can be mathematically compensated for in the diagnostic software.
Polar Plot and Geometry Analysis
Figures 9 to 11 show the polar analysis of the stator and rotor shape in three different regimes:
- Free run at 60 RPM (Figure 9)
- Free run at 100 RPM (Figure 10)
- Full load (Figure 11)
The rotor shape in Figure 9 shows that the rotor circularity was 2.1% and the shape was circular. At 100 RPM (Figure 10) the centrifugal forces started to stretch the rim. The rim distortion due to this stretch was more apparent in one direction than the other. The circularity offset was 5.9%. The major axis of the ellipse was in the direction of poles 32 to 68 and the small axis was in the direction of poles 15 to 51. Additional distortion was visible in the same direction (poles 32 to 68) in Figure 10 (full load) and the rim stiffness continued to decrease in the same direction.
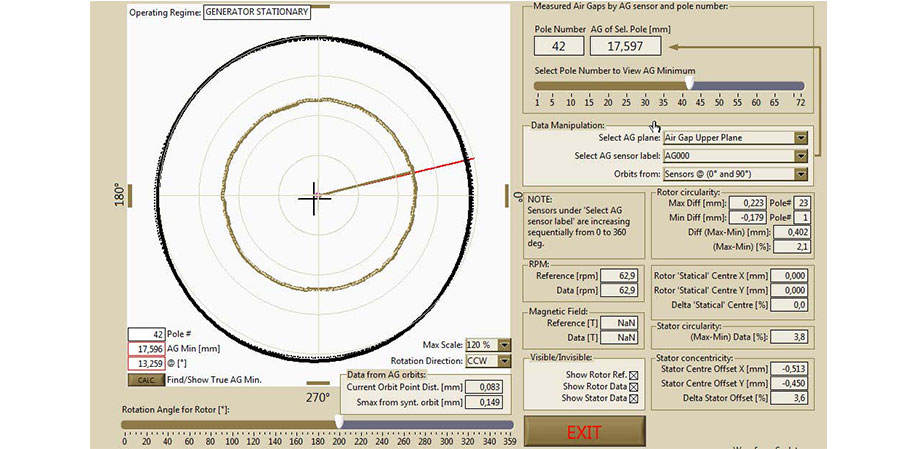
Figure 9. 60 RPM, unexcited – Polar plot of rotor and stator geometry from all air gap sensors simultaneously

Figure 10. 100 RPM, unexcited – Polar plot of rotor and stator geometry from all air gap sensors simultaneously
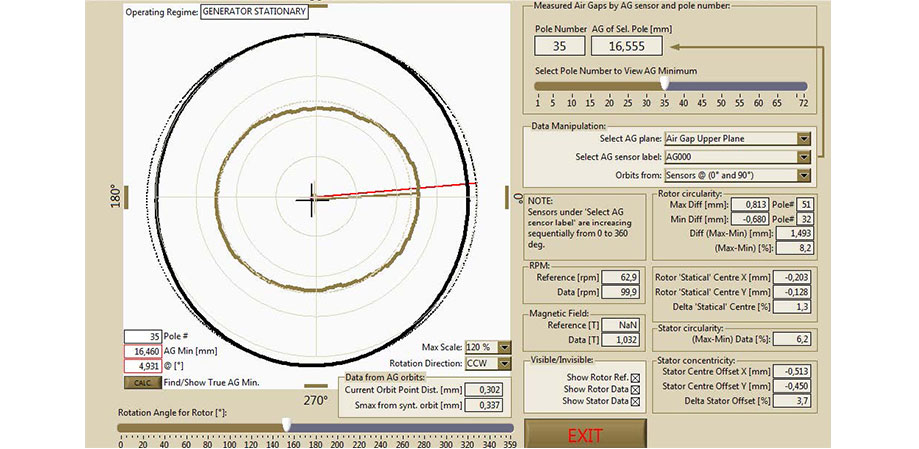
Figure 11. Full load – Polar plot of rotor and stator geometry from all air gap sensors simultaneously
Analysis of the circularity showed that the offset from a perfect circle (over the average gap) was growing with speed and magnetic field. The circularity offset at different regimes were:
– 2.1 % – Free run at 60 rpm – almost circular shape
– 5.9 % – free run at 100 rpm – elliptic shape
– 8.2 % – full load – elliptic shape
Following industry guidelines [2] adapted for dynamic meausrements the tolerances for rotor circularity should not exceed 6%. Unit B at full load steady state was 8.2% and outside of this guideline. This further illustrates that the radial stiffness of the rotor body was not symmetrical.
These polar diagrams show the following parameters:
- Rotor circularity offset n % to average gap (roundness based on true geometry)
- Rotor concentricity offset in % (offset of rotor center relative to rotor ideal center)
- Stator circularity (roundness)
- Stator concentricity offset in % (offset of stator center relative to rotor center)
- True minimum air gap position and pole number
- Rotor Dynamic center position (orbit position, and Smax – maximum displacement of center) Ideal rotor position and reference is free running, without excitation, in a cold state
For comparison two of these conditions were displayed as pole profile and compared to rotor pole magnetic field signal. The diagrams are shown in Figure 12. The compared conditions were at full load and free run at 60 RPM.
The upper diagrams in Figure 12 represent the air gap pole profiles at the operating regimes listed above. The lower diagrams represent the magnetic flux pole profile. Note that when the generator is at free run (Figure 12a) it is unexcited and there is no field, thus the pole profile is empty. The ovality of the rim is shown here with two maximums over one turn. It would represent a 2x (second harmonic of nominal speed) component of the air gap signal. This component can be tracked in real time and the alarm value can be set on it which will indicate further rim loosening.
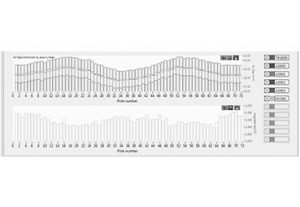
Figure 12 – Air gap and flux pole profile through different regimes– 12a – Free run 60 RPM; 12b – 100% of load
Data Recorded on Unit A and Comparison
The data recorded over a period of one year on unit A revealed that several load rejections occurred where the speed increased up to 150% of nominal speed (150 RPM) significantly increasing the centrifugal forces. Over speeds like this can eventually lead to a loose rim.
Figure 11 shows the rim distortion in over speed. It represents the minimum air gap values on each of the 4 sensors. The lower diagrams show RPM and Magnetic field and the upper diagrams show the Minimum air gap on all 4 sensors.
The air gap decreased under centrifugal forces by a maximum of 2.3mm (average value over 4 sensors). Comparing 150 RPM and 25RPM the overall distortion was 3.8mm as shown in Table 3.
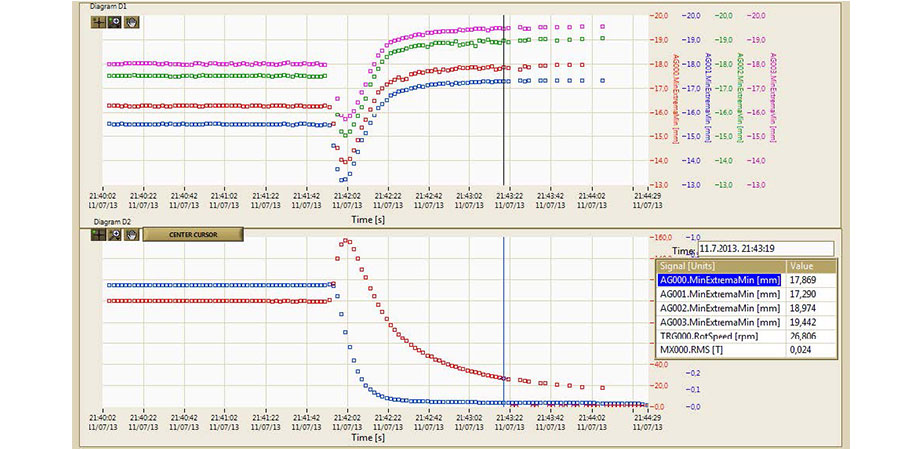
Figure 13. Overspeed / transient condition Upper diagram – Agmin AG0° (red), AG90° (blue), AG180° (green), AG270° (purple) in mm; Lower diagram – rotational speed (red) in rpm, magnetic flux (blue in T)
Table 3 – Minimum Air gap results
| Air Gap | Measured | Designed | ||
| Max (mm) | Min (mm) | Average (mm) | (mm) | |
| Top | 16.68 | 15.43 | 15.94 | 17.32 |
| Bottom | 17.04 | 15.79 | 16.31 | 17.47 |
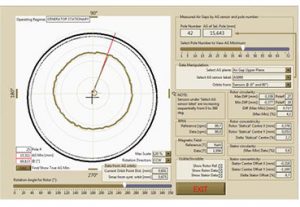
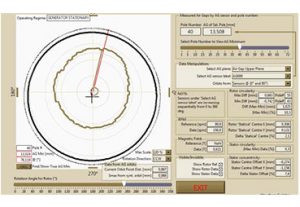
Figure 14. Polar plot of stator and rotor geometry from all 4 sensors @ 90º, 14a 100% RPM, 14b 157% RPMThe shape at 157% RPM (Figure 14) shows that the rim became distorted at over speed in the section between poles 35 to 55. This is the result of the centrifugal forces overcoming the pre-load forces in the rim due to the rim shrinking after being heated for assembly.
The circularity offset at different RPM in over speed was:
- 4.1% at 100 RPM
- 10.3% at 157 RPM
It was also seen that the dynamic eccentricity, represented by an orbit plot of rotor centre, increases with speed, i.e. the orbit (at the center of each diagram) is getting larger. This unit had several over speeds during the year that air gap and magnetic flux was added to the condition-based monitoring program. Analysis of the transient data did not indicate the rim was loose except at 157% of nominal RPM. During regular run up and coast down transient events the rim distortion was consistent for the whole year.
Conclusion
The significant damage experienced due to the stator and rotor rub on a small machine could have been prevented with air gap monitoring installed. This failure prompted the installation of CoDiS air gap monitoring systems on two larger machines in a more critical plant during refurbishment work.
Radial asymmetry of the rim was detected on unit B during machine commissioning. The results show that the rotor rim was distorting unevenly with the even radial forces, i.e. 72 centrifugal forces and 72 magnetic forces on the circumference of the rotor from 72 poles. The dynamic behaviour of the rotor center showed that here were no radial vibrations of rotor body detected. The polar diagrams show that this asymmetry was in one direction changing the shape of the rotor from circular (at 60% RPM) to oval (100% and higher). The circularity offset is slightly out of tolerance according to industry guidelines, but the fact that it was changing significantly with operating conditions requires that the condition be monitored to prevent machine failure. Long term operation with a loose rim could result in a crack in the rim segment or at the rim joints to the spider.
After the rim distortion was detected with air gap monitoring system complete rim inspection was conducted by the refurbishment contractor and adequate measures were proposed to monitor the problem. The conclusion is that rim looseness is not yet critical and the machine can operate but the end user must pay attention to monitoring results on regular basis. If the looseness becomes too large the machine should be stopped and rim to be re-shrunk.
This analysis and effective maintenance planning would not be possible without the use of condition-based monitoring of the generator rotor stator air gap and magnetic flux parameters. The monitoring system allows for continuous insight on machine behaviour and control over the fault that was detected. It also allows for alarming if the fault condition continues to degrade. The ability to compare unit B to the similar generator, unit A in relatively good condition, allows for a thorough severity assessment. Once the repairs are made to unit B the condition-based monitoring program will also be used to assess quality of work done.
With the detailed analysis of the data provided by the addition of air gap and magnetic flux to the condition-based monitoring program the impact of these over speed events on unit B can be assessed.
The radial stiffness was not consistent in normal operating conditions and the results in over speed were worse. It is possible that these over speed conditions could lead to additional reduction of rim stiffness. If there are several over speeds (such as on unit A) damage to the rim parts and joints are possible. The data recorded by the monitor during 5 months of operation on unit B showed no over speed events. The results showed that there was no additional degradation to the condition of the machine. There were approximately 15 starts and stops over a month which increased stress on the rim and is not ideal for long term, reliable operation.
References
[1] G.C. Stone et al., “Advancements in Integrated Generator Rotor and Stator Condition Monitoring,” presented at CIGRE Colloq. on Large Electrical Machines and Renewable Generation, Bucharest, 2013.
[2] “Hydroelectric Turbine Generator Units – Guide for Erection Tolerances and Shaft System Alignment, Part V”, Canadian Electrical Association (CEA), 1989, rev. 1998
[3] M.Jadrić, B.Rajković, B.Terzić, V.Firinger, M.Despalatović, Ž.Gladina, G.Orešković, B.Meško, J.Macan: ” NADZOR HIDROAGREGATA – Stanje i razvoj u Hrvatskoj elektroprivredi, proizvodno područje HE JugI1. FESB 2004
[4] O. Orešković., F. Tonković, O. Husnjak, T. Tonković: „ ” IDENTIFIKACIJA GEOMETRIJE I DINAMIČKIH SVOJSTAVA HIDRO GENERATORA NA TEMELJU ANALIZE SIGNALA ZRAČNOG RASPORA, HRO Cigre 2013
16
[5] C. Major, G. Allen, Y. Houle: Benefits of On-line Monitoring System in Operating and Refurbising Generators at Rapide-des-Iles-Powerplant, UPRATING AND REFURBISHING HYDRO PLANTS VI, Montral October 1997