
Abstract: Online partial discharge measurement in machines requires effective electrical noise suppression to reduce the risk of false indications of stator winding insulation problems. Many noise suppression techniques have been proposed and implemented over the years. This paper examines the method of suppressing noise using 3 phase synchronous (i.e. simultaneous) detection. Known noise pulses were recorded on three phases and they were contrasted with pulses from phase-to-ground PD in the stator slot or phase-to-phase PD between coils in the stator endwinding. Experiments indicated that interphasal PD produces strong pulses on 2 of the 3 phases. In contrast, phase-to-ground PD and noise caused by sparking in one phase of a generator output bus create a dominant pulse in one phase only. With all three types of situations, there may be significant cross-coupling to the other phase(s).
I. INTRODUCTION
On-line measurement of partial discharge (PD) is a well-established diagnostic tool, being used on many thousands of motors and generators to detect stator winding insulation problems [1-5]. Partial discharges are a symptom of many issues that may lead to insulation failure, including:
- Thermal deterioration,
- Mechanical looseness of coils in the stator slot,
- Contamination of the winding by partly conductive pollution,
- Manufacturing deficiencies such as poor electric stress relief coatings and coils that are too close together in the endwindings.
Generally there are several years between the onset of PD and when there is a significant risk of winding failure – which normally allows a long enough period to plan winding maintenance or rewinding.
As with all on-line electrical PD detection methods, the separation of stator winding PD from electrical noise pulses due to sources such as power system corona, power tool operation, inverters, poor electrical connections, etc. is critical if false indications of stator winding problems are to be minimized. Multiple ways have been proposed to separate PD from noise including [6]:
- Analog or digital filtering of the signals to a frequency range that maximizes the PD signal to noise ratio
- Gating (or blocking) of the signal when known noise is occurring
- Using two sensors per phase and implementing a “time-of-flight” algorithm to separate power system noise from stator PD based on the relative time of arrival at the two sensors [1,2]
- Pulse shape analysis where research has shown that the stator winding PD pulses have a shorter risetime or different oscillation/damping characteristics than noise [1,2]
- Using a time-frequency (T-W) map as developed by Montanari, et el, to note that noise can appear in clusters that are distinct from stator winding PD [5].
More recently researchers have proposed a method that assumes that noise may appear in all three phases at the same time – that is the concept of “three phase synchronicity” [4, 7]. Special “3PARD” plots are then used to locate clusters on a 3-dimensional plot as being associated with noise. A similar assumption on the three phase synchronicity of noise was proposed by the authors in the 1980s as a means of separating PD from noise [8]. The results of the earlier research seemed to indicate that the most common types of noise from the power system (sparking from flexible leads or poor electrical connections between the high voltage bus and support insulators) does not couple more or less equally into all three phases. Thus, given the recently proposed method in [4, 7], as well as the superior measurement equipment available today, we felt further examination of the three phase pulse characteristics was warranted.
At the same time as the noise measurements were performed, we also recorded PD pulses from the stator winding. Since some of the machines investigated had known PD occurring in the endwinding between two bars connected to the phase terminal in different phases (creating “interphasal” PD), we took the opportunity to record these pulses as well.
II. EXPERIMENTAL METHOD
The PD sensors used in all tested machines were 80 pF capacitive sensors that were permanently installed on the machine terminals [1,2]. The sensors fed the high input impedance of the oscilloscope and were terminated in 50 ohm at the PD pulse count recorder. The overall bandwidth of the detection system is 40 MHz to about 350 MHz. For the noise experiments on generators, two capacitive sensors were installed per phase on the generator output bus (Fig. 1). The sensors were separated by at least 2 meters. The source of any PD or sparking could be identified by the PD instrument as either coming from the stator winding; occurring on the bus between the two sensors per phase; or coming from the power system, based on the relative time of arrival of a pulse at the two sensors [1].
The oscilloscopes used were either a Tektronix TDS 3054C or an HP 54542A, both with 4 channels and a 500 MHz analog bandwidth. The PD pulse counter was a specially modified Iris Power TGA-B. This instrument digitally separates PD from power system noise using the time of arrival method, as well as determines the magnitude and phase position of the PD and noise pulses. This instrument was modified to produce a pulse to trigger the oscilloscope when a defined set of conditions was achieved – such as a positive stator winding PD pulse on Phase A that is occurring at 45o of the AC cycle. This allowed viewing pulse shapes on the oscilloscope that had a known pedigree, i.e., PD or noise (as determined by the relative time of arrival at the pair of sensors per phase), pulse polarity, phase position and sensor source.
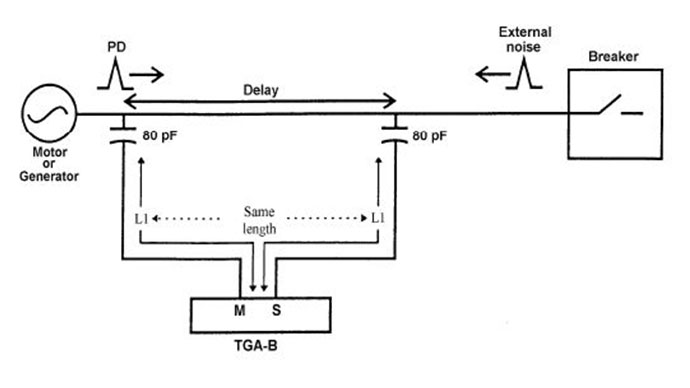
Figure 1: Use of the time of flight method to identify the source of a pulse as coming from the stator, between the two 80 pF capacitive sensors or from the power system. The “delay” is the time it takes a pulse to travel between the sensors, which is then input to the TGA-B to identify the pulse location.
III. NOISE CHARACTERISTICS
The experimental arrangement was applied to see the time domain characteristics of pulses that are known to come from the power system (classed as “system noise”). Fig. 2 shows the oscilloscope image of the pulses from the three phases of a 200 MVA, 18 kV air-cooled turbine generator operating near full power. Fig. 3 shows conventional stator PD and power system noise pulses measured and categorized by the PD measuring instrument on C phase. The stator winding PD and power system noise that is shown to be combined in Fig. 2 has been digitally separated in Fig. 3, pulse by pulse, using the time of flight method [2]. The digital separation of noise from PD makes each type of activity easily discernable in Fig. 3. The stator PD plot in Fig. 3 is consistent with void discharges in the insulation system, whereas the power system noise is occurring at the peaks of the AC cycle and in a “floating cloud”, which normally implies corona on the high voltage output bus.
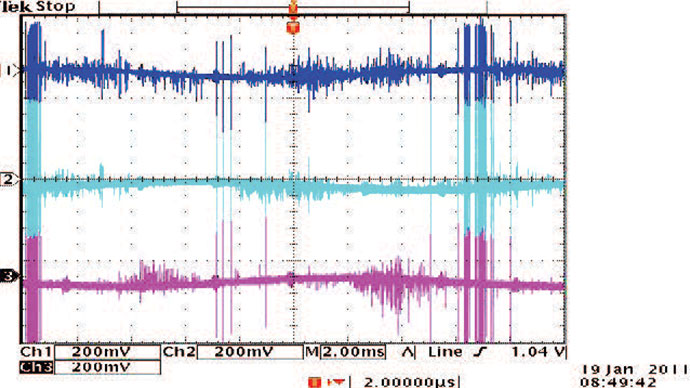
Figure 2: Oscilloscope image of the combined PD and noise signals from each phase. The vertical scale is the pulse magnitude and the horizontal scale is one 60 Hz AC cycle.
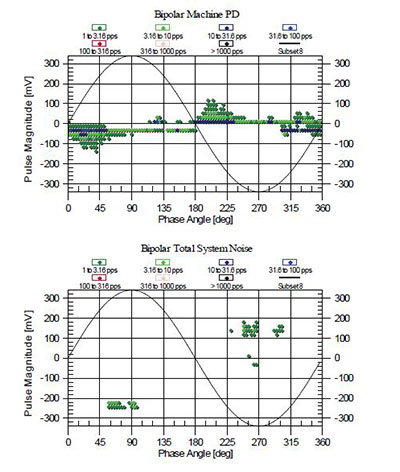
Figure 3. The top plot shows the stator winding PD activity versus AC phase position, while the bottom plot shows the noise from the power system as determined by the time of flight method. The vertical scale is the PD magnitude and the color of the dots represents the pulse count rate per second.
Fig. 4 shows the pulse detected on each phase for a single noise pulse in Fig. 2. The oscilloscope was triggered when he PD decoded a positive noise pulse from the power system. B phase showed the highest noise pulse magnitude, with -700 mV on the first peak, and the peak of the pulse envelope (representing the lower frequency response) being 900 mV. In contrast A and C phases had initial peaks of only about 100 mV and an envelope peak of about 200 mV. This was a consistent pattern, where the noise pulse was detected as a pulse of 3 to 4 times higher in the phase it originated, compared to the other two phases. Thus, external noise does not appear at about the same time and with about the same magnitude on all three phases as has been hypothesized in the past [3, 7, 8].
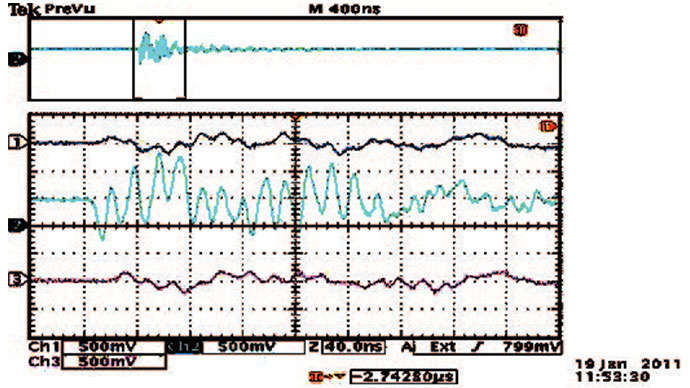
Figure 4. Oscilloscope of one noise pulse as detected on the PD sensors on each phase (bottom three traces). Phase B is the second from the bottom trace (pale blue).
IV. INTERPHASAL PD
The same 200 MVA generator described above also had confirmed PD occurring between line end bars in different phases. Fig. 5 shows the phase-resolved plots for the stator PD (for brevity the noise plots are not shown here), where the sinusoid shown is the phase-to-ground voltage. Note that each phase is phase-shifted by 120 degrees from each other. As described in [9], such phase-shifted PD plots enable PD occurring within the stator slot (caused by the phase to ground voltage) to be distinguished from the interphasal PD (caused by the phase to phase voltage). Cross-coupling from one phase into the other is also revealed. A vertical line through the three vertically-stacked plots represents pulse activity occurring at the same time. Interphasal PD occurs at the same time in two phases, with the pulses on each phase having the opposite polarity and approximately the same magnitude. In addition, the PD is closer to the zero crossing in one of the two phases, and the other phase has PD occurring closer to the AC peaks.
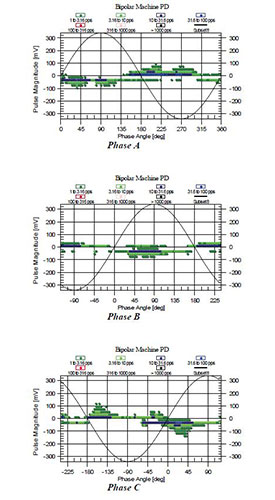
Figure 5: “Phase-shifted” plots that help to distinguish PD occurring phase-to-ground from PD occurring phase-to-phase.
Fig. 6 shows an example of the pulse detected by the sensors on each phase due to a single partial discharge between phases recorded by an oscilloscope. The oscilloscope was triggered by the PD instrument when a negative PD pulse (as determined by the time of flight method) was occurring on B phase near 90o of the AC cycle. The pulses in A phase and B phase occur within 10 ns of each other (the delay is due to different output bus distances from the stator winding to the PD sensors) and have about the same magnitude but the reverse polarity. The pulse in Phase C at approximately the same time is about 33% of the magnitude in A and B phases. In addition, it is in the wrong part of the AC phase cycle for PD on C phase. This is characteristic of a cross-coupled PD pulse. This oscilloscope data from an individual discharge between phases is consistent with the PD instrument plots in Fig. 5 which display hundreds of PD pulses. The reverse polarity effect is caused by Kirchhoff’s Current Law. In Fig. 7, CA and CBB are the capacitances of the groundwall insulation in the vicinity of the PD site, and CV is the air space capacitance between the coils that discharge. This creates a current pulse that flows through CBB, to the B phase PD sensor (80 pF capacitor), then through the 50 ohm resistor that detects the B phase pulse voltage (measured by the oscilloscope or PD instrument). The PD current pulse then flows through the ground and up into the A phase 50 ohm detection resistor, then the A phase PD sensor at the stator terminal. The loop is then completed when the PD current flows through the groundwall capacitance of A phase. If we take the polarity of the voltage pulse across the resistor to be positive (with respect to ground) when the pulse current enters the resistor, then it is clear that the pulse detected by the two 50 ohm resisters will have an opposite polarity.
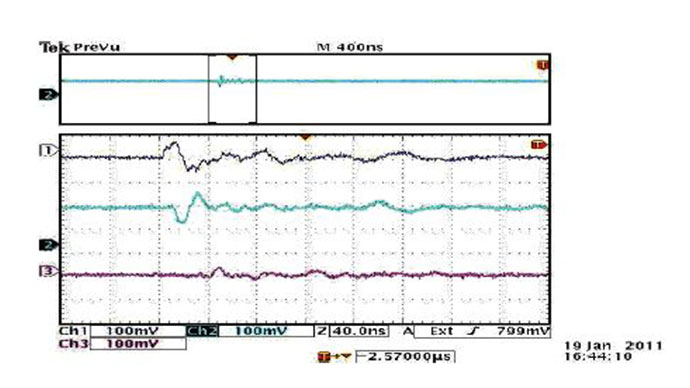
Figure 6: Oscilloscope image of the pulses recorded from the three phases, when the PD is known to be between A and B phases in the endwinding.
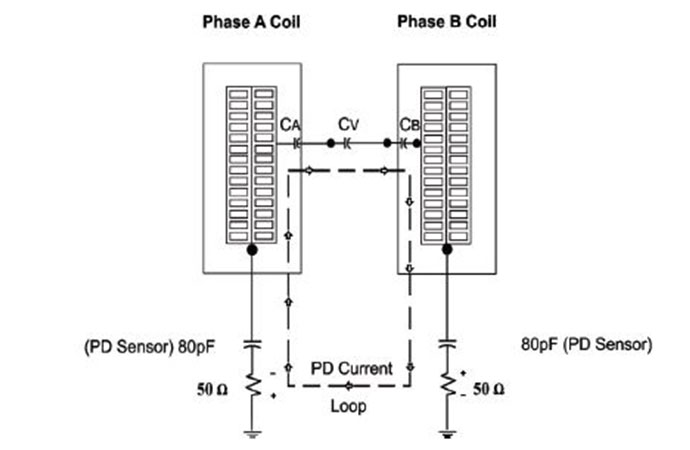
Figure 7. Diagram showing why the PD between a Phase A line end coil and a Phase B line end coil produces opposite polarity pulses from the 80 pF PD sensors connected to the stator winding phase terminals.
Figs. 8 and 9 show additional examples of PD pulses captured in an operating 13.2 kV, 3500 HP condensate motor in a nuclear plant. The motor has known endwinding PD between phases as well as PD within voids in the slot portion of the coil. Fig. 8 shows the interphasal PD between A and B phases, and has the same characteristics as shown for the turbine generator in Fig. 6. Note that the cross coupling to C phase was only about 20% in this case. PD caused by the phase-to-ground voltage on a C phase coil in the stator slot is shown in Fig. 9. About 50% of the C phase PD signal cross-couples into the A and B phase PD sensors.

Figure 8: Oscilloscope signals for an interphasal PD in the endwinding of a motor. The top three traces are from Phases A, B and C, respectively.
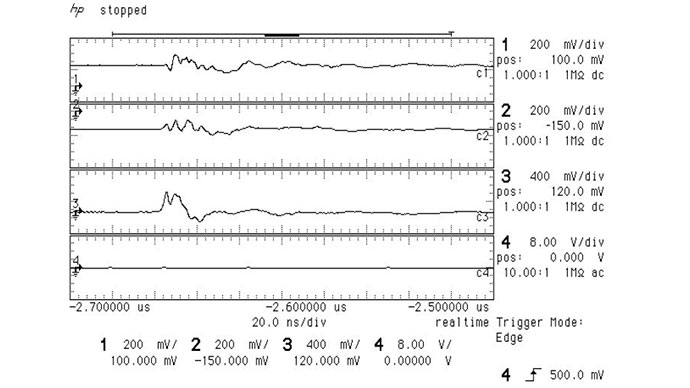
Figure 9: Normal PD occurring in the slot of the same motor as in Figure 8.
V. CONCLUSIONS
Synchronous detection of PD on three phases is said to allow the separation of stator winding PD from electrical interference since PD on one phase will have a much larger magnitude on the phase it occurs in, while noise will have about the same magnitude on all three phases. The result is that in a three axis diagram (3PARD), where the pulse amplitude represents the distance along the axis for each phase, PD should be primarily along the phase axis in which the PD is occurring. Noise, on the other hand, should not be predominantly on one of the axis, but rather it is postulated to appear as a cluster “floating” within the three dimensional diagram.
Based on recent experiments, as well as research done in the 1980s [8], it seems these assumptions are not always valid. External noise can clearly cause a much bigger pulse amplitude on one phase compared to the other two. Thus separating stator PD from power system noise based on the synchronous detection of pulses on all three phases may lead to incorrect conclusions. Furthermore, cross-coupling can induce significant pulses in phases other than the phase experiencing the PD. Finally, interphasal PD may cause confusion since it can result in complex mix of pulse magnitudes and polarities between the phases.
VI. REFERENCES
[1] S.R. Campbell et al, “Practical On-Line PD Tests for Turbine Generators and Motors”, IEEE Trans EC, June 1994, pp281-287.
[2] G.C. Stone, V. Warren, “Objective Methods to Interpret PD Data on Rotating Machine Stator Windings”, IEEE Trans Industry Applications, Jan 2006, pp 195-200.
[3] W. Koltunowicz et al, “Continuous PD Monitoring of Stator Insulation”, Proceedings of IEEJ International Conference on Condition Monitoring and Diagnostics, Tokyo, Sept 2010, pp 355-358.
[4] G. Schmidt et al, “On-line and Off-line Diagnostics as a Successful Interaction for CBM on Turbo generators”, Proceedings of IEEJ International Conference on Condition Monitoring and Diagnostics, Tokyo, Sept 2010, pp 364-367.
[5] A. Cavallini, et al, “Advanced PD Inference in On-Field Measurements– Part 1 Noise Rejection”, IEEE Trans DEI, Jan 2003, pp 216-224.
[6] G.C. Stone, “PD Diagnostics and Electrical Equipment Insulation Condition”, IEEE Trans DEI, Oct 2005, pp 891-904.
[7] W. Koltunowicz, R. Plath, “Synchronous Multichannel PD Measurements”, IEEE Trans DEI, December 2008, pp 1715-1723.
[8] H.G. Sedding, S.R. Campbell, G.C. Stone, “Evaluation of Coupling Devices for In-Service PD Detection on Thermal Alternators”, Canadian Electrical Association Research Report 738 G 631, November 1992.
[9] V. Warren et al, “Advancements in Partial Discharge Analysis to Diagnose Stator Winding Problems”, IEEE Proc International Symposium Electrical Insulation, June 2000, pp 497 -501.