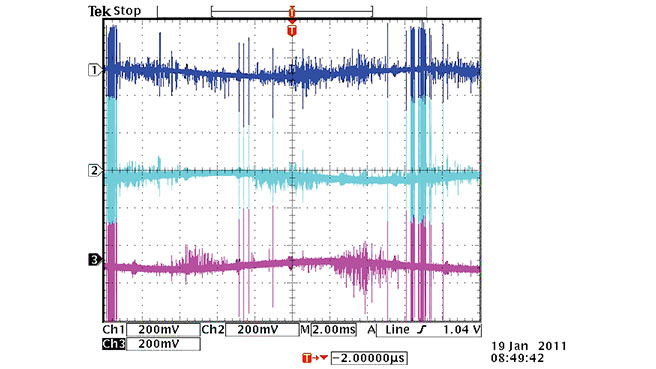
Figure 5. Oscilloscope image of the combined PD and noise signals from each phase. The vertical scale is pulse magnitude and the horizontal scale is one 60 Hz AC cycle.
Oscilloscope-image-of-the-combined-PD-and-noise-signals-from-each-phase

Figure 5. Oscilloscope image of the combined PD and noise signals from each phase. The vertical scale is pulse magnitude and the horizontal scale is one 60 Hz AC cycle.
Oscilloscope-image-of-the-combined-PD-and-noise-signals-from-each-phase